Volume 27, Number 1—January 2021
Dispatch
Prevalence of SARS-CoV-2, Verona, Italy, April–May 2020
Cite This Article
Citation for Media
Abstract
We used random sampling to estimate the prevalence of severe acute respiratory syndrome coronavirus 2 infection in Verona, Italy. Of 1,515 participants, 2.6% tested positive by serologic assay and 0.7% by reverse transcription PCR. We used latent class analysis to estimate a 3.0% probability of infection and 2.0% death rate.
On May 25, 2020, Italy had the third highest number of cases and the second highest number of deaths in Europe caused by the novel betacoronavirus severe acute respiratory syndrome coronavirus 2 (SARS-CoV-2) (1) as part of the ongoing pandemic of coronavirus disease (COVID-19). The continuing spread of infection and the resulting strain on healthcare systems has made the identification of asymptomatic persons crucial to limiting transmission (2–6). We conducted a cross-sectional study on a representative sample of the general population to estimate the prevalence and death rate of SARS-CoV-2 infection in Verona, Italy.
We estimated the prevalence of active or past SARS-CoV-2 infection among the population of Verona among randomly selected participants >10 years of age. This investigation was an observational, cross-sectional study approved by the Ethics Committee of Verona and Rovigo provinces on April 15, 2020 (internal protocol no. 2641CESC), in compliance with the Strengthening the Reporting of Observational Studies in Epidemiology guidelines (7).
According to Verona’s municipal register, 235,034 persons >10 years of age lived in Verona on January 1, 2020 (8). We used systematic random sampling to compile a list of potential participants. Because the prevalence of asymptomatic SARS-CoV-2 infection in Italy had previously been estimated at 10.0% (9,10), we decided to randomly sample 1,527 participants, resulting in a standard error of <1.5%. We predicted a dropout rate of 35% and accordingly mailed invitations to 2,061 potential participants. We selected the first sample using a random starting point; for subsequent samples, we used a sampling interval calculated by dividing the population size by the desired sample size (235,034/2,061 = 114).
We collected data from April 24 through May 8, 2020. We required a parent’s or guardian’s consent for participants <18 years of age. All participants gave their informed consent. Participants first completed a phone interview about COVID-19 symptoms within the previous 15 days. Specialized staff at Istituto di Ricovero e Cura a Carattere Scientifico then collected blood and nasopharyngeal swab samples from each participant. These staff extracted total RNA from nasopharyngeal swab samples using a MagnaPure LC.2 instrument and MagNA Pure LC RNA Isolation Kit (Roche Molecular Systems Inc., https://lifescience.roche.com), according to the manufacturer’s instructions. We analyzed the eluted RNA by reverse transcription PCR (RT-PCR) to detect the presence of active infections (11). We analyzed serum samples for IgG against SARS-CoV-2 by serologic assay (Abbott, https://www.abbott.com) to detect previous infections. Experienced laboratory personnel conducted each test independently and blindly.
Because neither assay has perfect sensitivity, we used latent class analysis (LCA) to estimate the prevalence of SARS-CoV-2 infection. LCA models were based on SARS-CoV-2 test results and selected clinical variables (12). We interpreted the outcomes as the probability that a given person was (or had been) infected (13). We reported all parameters and estimations with 95% CIs. We adjusted statistical models and estimations for covariates.
Figure
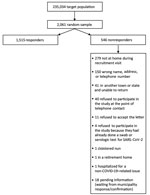
Figure. Flowchart of participant testing for SARS-CoV-2 infection, Verona, Italy, 2020. COVID-19, coronavirus disease; SARS-CoV-2, severe acute respiratory syndrome coronavirus 2.
A total of 1,515 persons participated in the study (Figure). We found no significant difference in sex proportions between the general population (53% female) and the study sample (54% female). The mean age of all participants was 52.1 (SD = 20.0) years in the general population and 49.1 (SD = 22.2) years in the study sample. We summarized demographic and clinical data using descriptive statistics and measures of variability and precision (Table 1). Of 1,515 participants, 9 (0.6%) tested positive for SARS-CoV-2 RNA but negative for IgG against SARS-CoV-2, 40 (2.6%) tested negative for viral RNA but positive for IgG, and 1,465 (96.7%) tested negative for both indicators. Only 1 participant tested positive for RNA and IgG. Participants who tested negative for viral RNA but positive for IgG reported symptoms such as anosmia (39.5%), temperature >37.5°C (30.8%), fatigue (35.9%), and persistent cough (28.2%). Less than 2% of participants who tested negative by both tests reported symptoms.
We used a backward stepwise multinomial multivariate logistic regression model to compare selected COVID-19 symptoms (i.e., anosmia, dyspnea, diarrhea, and fever) in the RNA-positive and RNA-negative/IgG-positive groups with the RNA-negative/IgG-negative group. Fever and anosmia were each significantly associated with belonging to the RNA-negative/IgG-positive group (p<0.01) but not the RNA-positive group.
We used LCA to estimate the prevalence of infection considering the results of RT-PCR, the serologic assay, and the symptoms selected by stepwise regression. The estimated probability of belonging to class 1 (uninfected) was 0.97 and class 2 (infected) was 0.03 (Table 2).
As of May 25, 2020, Verona had 1,528 cumulative patients in whom SARS-CoV-2 infection was diagnosed, including 144 who had died, indicating a 9.4% death rate (14). Verona was the province in Veneto with the most cases and deaths caused by SARS-CoV-2 (15). Our LCA estimated a prevalence of 3.0%, suggesting 7,051 cumulative cases (4.6 times higher than the official count). These estimates suggest that 144 reported deaths would indicate a 2.0% death rate. According to the crude rates, the 50 SARS-CoV-2–positive participants in our study would account for 3.3% of the total study population. Applying this percentage to the whole population of Verona would indicate 7,756 cases and a 1.9% death rate.
Of the 10 RNA-positive participants, only 1 tested positive by serologic assay. This finding raises concerns about the current screening policy of 2-step testing, which comprises a serologic assay and, if the assay results are positive, PCR. Given the economic costs associated with testing, officials should carefully advise the public on all testing options.
Our study has a few limitations. Because participation was voluntary, our study might have been influenced by selection bias (Figure). Also, LCA might have underestimated the accuracy of both diagnostic tests. For example, considering past and active infections together might have reduced test sensitivity. Furthermore, the PCR assay did not have 100% specificity, as is usually assumed (A.N. Cohen, unpub. data, https://www.medrxiv.org/content/10.1101/2020.04.26.20080911v4). The model might have also underestimated the specificity of the serologic assay. However, the crude rates estimate a prevalence only slightly higher, and the death rate only slightly lower, than predicted by our model.
Our study estimated the prevalence of SARS-CoV-2 infection in Verona using a random sample of its population. Similar studies are currently underway on a larger scale. The results will estimate the true circulation of SARS-CoV-2, better approximate the death rate, and inform infection containment and management. Our study provides a clear picture of the circulation of SARS-CoV-2 infection in the general population of a city and an estimation of the true death rate caused by the infection. The results also suggest that 2-step testing might not detect all active infections. We are currently organizing phase 2 of our study, during which we will conduct follow-up serologic testing on all PCR-positive and PCR-negative/IgG-positive participants, enabling the evaluation of any antibody seroconversion, negativization, or change in titer.
Dr. Guerriero is a senior epidemiologist and biostatistician at the Clinical Research Unit, Istituto di Ricovero e Cura a Carattere Scientifico Sacro Cuore Don Calabria Hospital. His primary research interests are prevalence cross-sectional studies and advanced models in medicine statistics.
Acknowledgments
We thank Nicoletta De Santis for editing, Elinor Julie Rae Anderson for language editing and Luciano Marchiori and Luca Heller for helping with data collection. We are also grateful to the laboratory team of the Microbiology Unit of Istituto di Ricovero e Cura a Carattere Scientifico Sacro Cuore Don Calabria Hospital for performing the tests and helping with the database.
This work was partially supported by the Italian Ministry of Health under “Fondi Ricerca Corrente - Linea 1” and ”Progetto COVID Ricerca Finalizzata 2020 12371675” to Istituto di Ricovero e Cura a Carattere Scientifico Sacro Cuore Don Calabria Hospital.
References
- World Health Organization. Coronavirus disease (COVID-19) situation report—126. 2020 May 25 [cited 2020 May 25]. https://www.who.int/docs/default-source/coronaviruse/situation-reports/20200525-covid-19-sitrep-126.pdf
- Chan JF, Yuan S, Kok KH, To KK, Chu H, Yang J, et al. A familial cluster of pneumonia associated with the 2019 novel coronavirus indicating person-to-person transmission: a study of a family cluster. Lancet. 2020;395:514–23. DOIPubMedGoogle Scholar
- Liu YC, Liao CH, Chang CF, Chou CC, Lin YR. A locally transmitted case of SARS-CoV-2 infection in Taiwan. N Engl J Med. 2020;382:1070–2. DOIPubMedGoogle Scholar
- Rocklöv J, Sjödin H, Wilder-Smith A. COVID-19 outbreak on the Diamond Princess cruise ship: estimating the epidemic potential and effectiveness of public health countermeasures. J Travel Med. 2020;27:taaa030.
- Nishiura H, Kobayashi T, Miyama T, Suzuki A, Jung SM, Hayashi K, et al. Estimation of the asymptomatic ratio of novel coronavirus infections (COVID-19). Int J Infect Dis. 2020;94:154–5. DOIPubMedGoogle Scholar
- Arons MM, Hatfield KM, Reddy SC, Kimball A, James A, Jacobs JR, et al.; Public Health–Seattle and King County and CDC COVID-19 Investigation Team. Presymptomatic SARS-CoV-2 infections and transmission in a skilled nursing facility. N Engl J Med. 2020;382:2081–90. DOIPubMedGoogle Scholar
- STROBE statement: strengthening the reporting of observational studies in epidemiology. 2014 Jan 9 [cited 2020 May 31]. https://www.strobe-statement.org/index.php?id=strobe-home
- Istituto Nazionale di Statistica. Demografia in cifre. 2020 Oct 1 [cited 2020 May 31]. demo.istat.it/index.html
- Università degli Studi di Milano. Doxa: potrebbero essere oltre 5 milioni gli italiani infettati da COVID-19 a marzo 2020. 2020 Apr 2 [cited 2020 May 31]. https://lastatalenews.unimi.it/doxa-potrebbero-essere-oltre-5-milioni-italiani-infettati-covid-19-marzo-2020
- De Natale G, Ricciardi V, De Luca G, De Natale D, Di Meglio G, Ferragamo A, et al. The COVID-19 infection in Italy: a statistical study of an abnormally severe disease. J Clin Med. 2020;9:1564. DOIPubMedGoogle Scholar
- Corman VM, Landt O, Kaiser M, Molenkamp R, Meijer A, Chu DK, et al. Detection of 2019 novel coronavirus (2019-nCoV) by real-time RT-PCR. Euro Surveill. 2020;25:
2000045 . DOIPubMedGoogle Scholar - Goodman LA. Latent class analysis: the empirical study of latent types, latent variables, and latent structures. In: Hagenaars JA, McCutcheon AL, editors. Applied Latent Class Analysis. Cambridge (UK): Cambridge University Press; 2002. p. 3–55.
- Goetghebeur E, Liinev J, Boelaert M, Van der Stuyft P. Diagnostic test analyses in search of their gold standard: latent class analyses with random effects. Stat Methods Med Res. 2000;9:231–48. DOIPubMedGoogle Scholar
- Azienda Zero–Regione del Veneto. SARS-CoV-2 in Veneto. 2020 [cited 2020 May 25]. https://www.azero.veneto.it/-/emergenza-coronavirus
- Bollettino Regione Veneto. Report del 31.05 ore 17.00. 2020 [cited 2020 June 1]. https://www.larena.it/filedelivery/policy:7.2807808:1590944213/aggiornamentotrentuno.pdf
Figure
Tables
Cite This ArticleOriginal Publication Date: December 01, 2020
1These authors contributed equally to this article.
Table of Contents – Volume 27, Number 1—January 2021
| EID Search Options |
|---|
|
|
|
|
|
|
Please use the form below to submit correspondence to the authors or contact them at the following address:
Zeno Bisoffi, Dipartimento di Malattie Infettive Tropicali e Microbiologia (DITM), IRCCS Ospedale Sacro Cuore Don Calabria, Via Sempreboni 5, 37024 Negrar (Verona), Italy
Top