Skip directly to site content Skip directly to page options Skip directly to A-Z link Skip directly to A-Z link Skip directly to A-Z link
Volume 27, Number 11—November 2021
Dispatch

Co-infection with Legionella and SARS-CoV-2, France, March 2020

Camille Allam, Alexandre Gaymard, Ghislaine Descours, Christophe Ginevra, Laurence Josset, Maud Bouscambert, Laetitia Beraud, Marine Ibranosyan, Camille Golfier, Arnaud Friggeri, Bruno Lina, Christine Campèse, Florence Ader, Sophie JarraudComments to Author , and COVID-19 diagnosis HCL consortium1
Author affiliations: Hospices Civils de Lyon, Lyon, France (C. Allam, A. Gaymard, G. Descours, C. Ginevra, L. Josset, L. Beraud, M. Ibranosyan, C. Golfier, A. Friggeri, B. Lina, F. Ader, S. Jarraud); Université de Lyon, Lyon (C. Allam, A. Gaymard, G. Descours, C. Ginevra, L. Josset, M. Ibranosyan, B. Lina, F. Ader, S. Jarraud); Centre International de Recherche en Infectiologie, Lyon (C. Allam, A. Gaymard, G. Descours, C. Ginevra, L. Josset, B. Lina, F. Ader, S. Jarraud); Santé Publique France, Saint-Maurice, France (C. Campèse)

Main Article

Figure 2

Timeline of detection of SARS-CoV-2 and Legionella in patient 1, a 71-year-old man receiving chemotherapy for multiple myeloma, France, March 2020. A) Serum Legionella DNA load estimated by qPCR Ct and SARS-CoV-2 RNA load expressed as the number of log10 RNA copies/mL serum. B) Pulmonary Legionella DNA load estimated by qPCR Ct, targeting the 16sRNA gene (R-DiaLeg, Diagenode, https://www.diagenode.com) and SARS-CoV-2 RNA load (Institut Pasteur, Paris protocol). Arrows indicate dates of computed tomography scans, green triangles indicates dates of positive Legionella cultures, and orange circle indicates date of lung microbiome testing. Values are normalized according to cellular quantification using the CELL Control r-gene kit (bioMérieux, https://www.biomerieux.com) and expressed as the number of log10 RNA copies/100 cells from pulmonary TA and BAL. BAL, broncho-alveolar lavage; Ct, cycle threshold; D, days after onset of symptoms; qPCR, quantitative PCR; SARS-CoV-2, severe acute respiratory syndrome coronavirus 2; TA, tracheal aspirations.

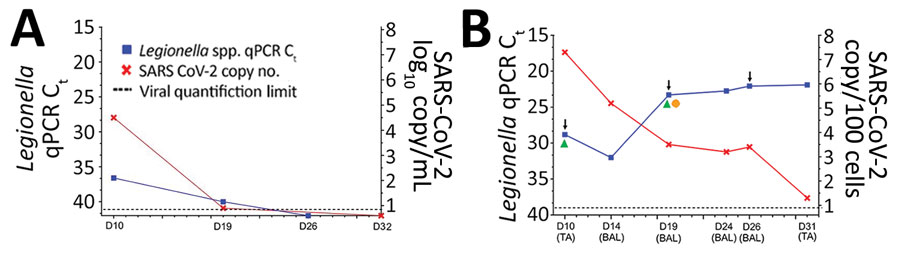
Figure 2. Timeline of detection of SARS-CoV-2 and Legionella in patient 1, a 71-year-old man receiving chemotherapy for multiple myeloma, France, March 2020. A) Serum Legionella DNA load estimated by qPCR Ct and SARS-CoV-2 RNA load expressed as the number of log10 RNA copies/mL serum. B) Pulmonary Legionella DNA load estimated by qPCR Ct, targeting the 16sRNA gene (R-DiaLeg, Diagenode, https://www.diagenode.com) and SARS-CoV-2 RNA load (Institut Pasteur, Paris protocol). Arrows indicate dates of computed tomography scans, green triangles indicates dates of positive Legionella cultures, and orange circle indicates date of lung microbiome testing. Values are normalized according to cellular quantification using the CELL Control r-gene kit (bioMérieux, https://www.biomerieux.com) and expressed as the number of log10 RNA copies/100 cells from pulmonary TA and BAL. BAL, broncho-alveolar lavage; Ct, cycle threshold; D, days after onset of symptoms; qPCR, quantitative PCR; SARS-CoV-2, severe acute respiratory syndrome coronavirus 2; TA, tracheal aspirations.

Main Article

1Members are listed at the end of this article.

Page created: August 12, 2021
Page updated: October 19, 2021
Page reviewed: October 19, 2021
The conclusions, findings, and opinions expressed by authors contributing to this journal do not necessarily reflect the official position of the U.S. Department of Health and Human Services, the Public Health Service, the Centers for Disease Control and Prevention, or the authors' affiliated institutions. Use of trade names is for identification only and does not imply endorsement by any of the groups named above.
file_external