Volume 27, Number 11—November 2021
Dispatch
Acute Chagas Disease Manifesting as Orbital Cellulitis, Texas, USA
Figure 2
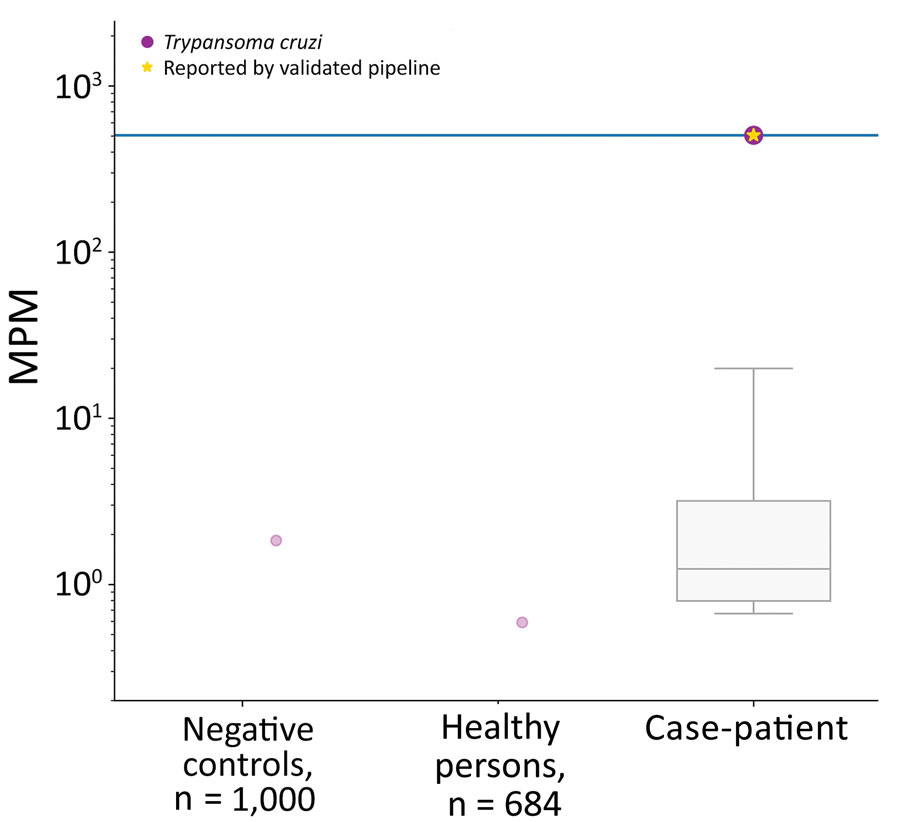
Figure 2. Results of next-generation sequencing on a plasma sample of a patient with acute Chagas disease manifesting as orbital cellulitis, Texas, USA, showing the very high detection of Trypanosoma cruzi (505.61 MPM) (right). The comparison with 1,000 aggregated negative controls (buffer/reagents) show a very low microbial cell-free DNA (mcfDNA) signal, which aligned to T. cruzi in 1 sample (left). A cohort of 684 healthy controls had a very low mcfDNA signal, which aligned to T. cruzi in 1 person (middle). The purple dots indicate any mcfDNA that align to T. cruzi; the gold star indicates an mcfDNA detection that represents a positive result for T. cruzi identified by the Karius Test (Karius, Inc., https://kariusdx.com). The other detected but not clinically or statistically significant mcfDNA in the case patient’s sample are also shown in the gray box and whisker plot on the log scale; horizontal line within box indicates median, box top and bottom indicate interquartile range (Q1–Q3), and error bars indicate range. MPM, molecules/μL.