Volume 27, Number 12—December 2021
Dispatch
Incubation Period for Neuroinvasive Toscana Virus Infections
Lison Laroche1 , Frédéric Jourdain1, Nazli Ayhan, Anne-Laure Bañuls, Rémi Charrel, and Jorian Prudhomme
Figure 2
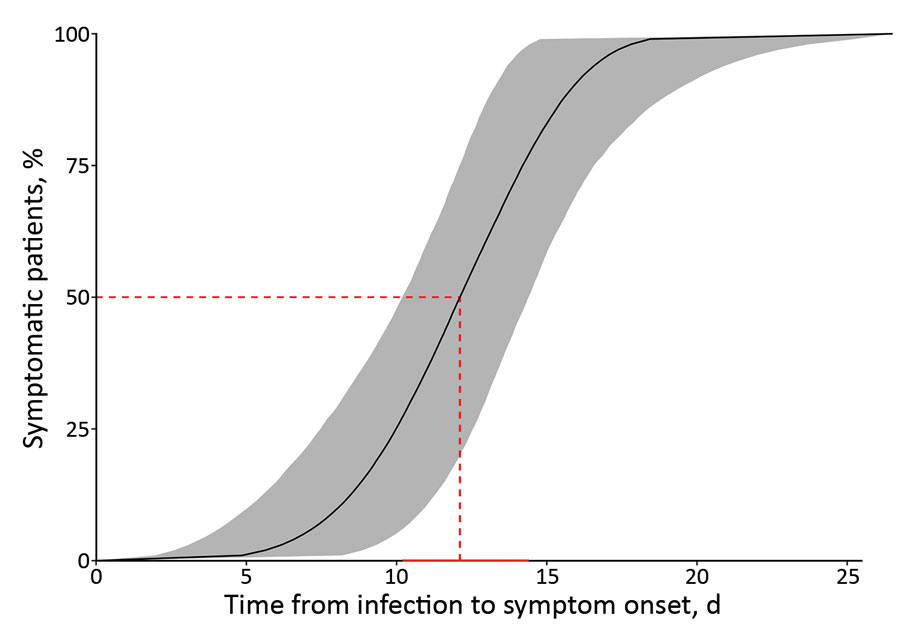
Figure 2. Cumulative percentage of Toscana virus cases manifesting with neurologic symptoms by a given day under the estimates for the Weibull parametric distribution (n = 24). Red dashed line represents the median estimation of the incubation period. Solid red horizontal line represents the 95% CI of the median. Gray shading indicates the 95% CI of the values.
1These authors contributed equally to this article.
Page created: September 22, 2021
Page updated: November 19, 2021
Page reviewed: November 19, 2021
The conclusions, findings, and opinions expressed by authors contributing to this journal do not necessarily reflect the official position of the U.S. Department of Health and Human Services, the Public Health Service, the Centers for Disease Control and Prevention, or the authors' affiliated institutions. Use of trade names is for identification only and does not imply endorsement by any of the groups named above.