Coronavirus Disease Contact Tracing Outcomes and Cost, Salt Lake County, Utah, USA, March–May 2020
Victoria L. Fields, Ian T. Kracalik, Christina Carthel, Adriana Lopez, Amy Schwartz, Nathaniel M. Lewis, Mackenzie Bray, Carlene Claflin, Kilee Jorgensen, Ha Khong, Walter Richards, Ilene Risk, Maureen Smithee, Madison Clawson, Lee Cherie Booth, Tara Scribellito, Jason Lowry, Jessica Huynh, Linda Davis, Holly Birch, Tiffany Tran, Joseph Walker, Alicia Fry, Aron Hall, Jodee Baker, Eric Pevzner, Angela C. Dunn, Jacqueline E. Tate, Hannah L. Kirking, Tair Kiphibane, and Cuc H. Tran

Author affiliations: Centers for Disease Control and Prevention, Atlanta, Georgia, USA (V.L. Fields, I.T. Kracalik, A. Lopez, A. Schwartz, N.M, Lewis, T. Tran, J. Walker, A. Fry, A. Hall, E. Pevzner, J.E. Tate, H.L. Kirking, C.H. Tran); Salt Lake County Health Department, Salt Lake City, Utah, USA (C. Carthel, M. Bray, C. Claflin, K. Jorgensen, H. Khong, W. Richards, I. Risk, M. Smithee, M. Clawson, L.C. Booth, T. Scribellito, J. Lowry, J. Huynh, L. Davis, H. Birch, A.C. Dunn, T. Kiphibane); Utah Department of Health, Salt Lake City (J. Baker)
Main Article
Figure 3

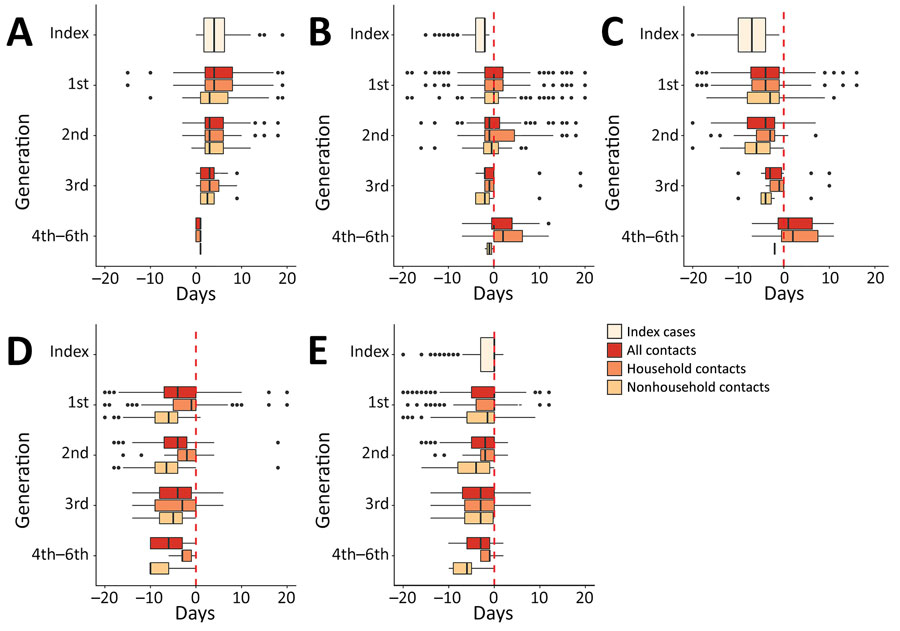
Figure 3. Box-and-whisker plots showing time from key coronavirus disease contact tracing–associated dates to other key dates, Salt Lake County, Utah, USA, March–May 2020. A) Days from symptom onset to PCR testing; B) days from PCR testing to initial interaction with Salt Lake County Health Department (SLCoHD); C) days from symptom onset to initial interaction with SLCoHD; D) days from last day of exposure to a confirmed or probable case to initial interaction with SLCoHD; E) days from monitoring start date to initial interaction with SLCoHD. The all contacts category includes contacts with an unknown relationship to a confirmed or probable case. Dotted red lines represent when the Salt Lake County Health Department had initial interactions with cases or contacts. Vertical lines within boxes indicate the median, left and right box edges indicate the interquartile range (IQR), and whiskers indicate the lower extreme and upper extreme quartiles; black dots indicate outliers. Negative values along the x-axis indicate that the second event happened before the first event.
Main Article
Page created: September 09, 2021
Page updated: November 19, 2021
Page reviewed: November 19, 2021
The conclusions, findings, and opinions expressed by authors contributing to this journal do not necessarily reflect the official position of the U.S. Department of Health and Human Services, the Public Health Service, the Centers for Disease Control and Prevention, or the authors' affiliated institutions. Use of trade names is for identification only and does not imply endorsement by any of the groups named above.
