Volume 27, Number 12—December 2021
Dispatch
Large-Scale Screening of Asymptomatic Persons for SARS-CoV-2 Variants of Concern and Gamma Takeover, Brazil
Douglas Adamoski1 , Jaqueline Carvalho de Oliveira, Ana Claudia Bonatto, Roseli Wassem, Meri Bordignon Nogueira, Sonia Mara Raboni, Edvaldo da Silva Trindade, Emanuel Maltempi de Souza, Daniela Fiori Gradia1, and SCB-UFPR COVID-19 team,2
Figure 2
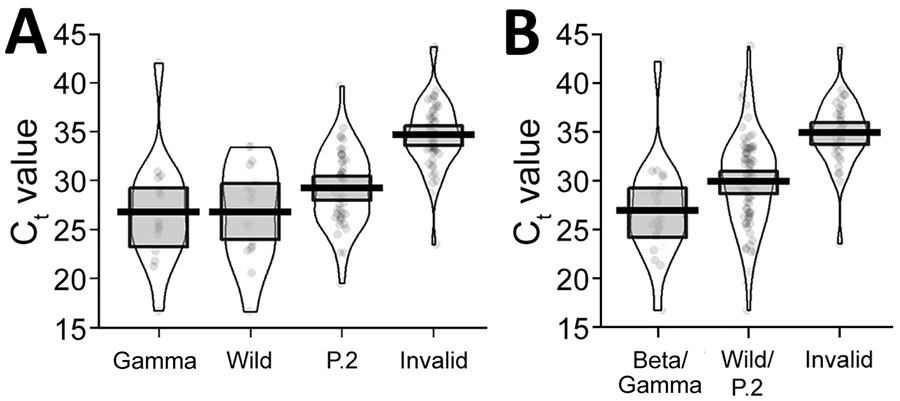
Figure 2. Violin plots of diagnostic Ct values for severe acute respiratory syndrome coronavirus 2–positive cases in Paraná state, Brazil, and detection performance for singleplex (A) and multiplex (B) genotyping methods. Violin plots are made by kernel-smoothed density plots from the actual data (represented by the dots). Horizonal lines within boxes indicate medians; upper and lower box limits indicate interquartile ranges. Ct, cycle threshold.
1These authors were co–principal investigators.
2Members of the group are listed at the end of this article.
Page created: September 13, 2021
Page updated: November 19, 2021
Page reviewed: November 19, 2021
The conclusions, findings, and opinions expressed by authors contributing to this journal do not necessarily reflect the official position of the U.S. Department of Health and Human Services, the Public Health Service, the Centers for Disease Control and Prevention, or the authors' affiliated institutions. Use of trade names is for identification only and does not imply endorsement by any of the groups named above.