Volume 27, Number 2—February 2021
Research
Use of Commercial Claims Data for Evaluating Trends in Lyme Disease Diagnoses, United States, 2010–2018
Amy M. Schwartz, Kiersten J. Kugeler, Christina A. Nelson, Grace E. Marx, and Alison F. Hinckley
Figure 4
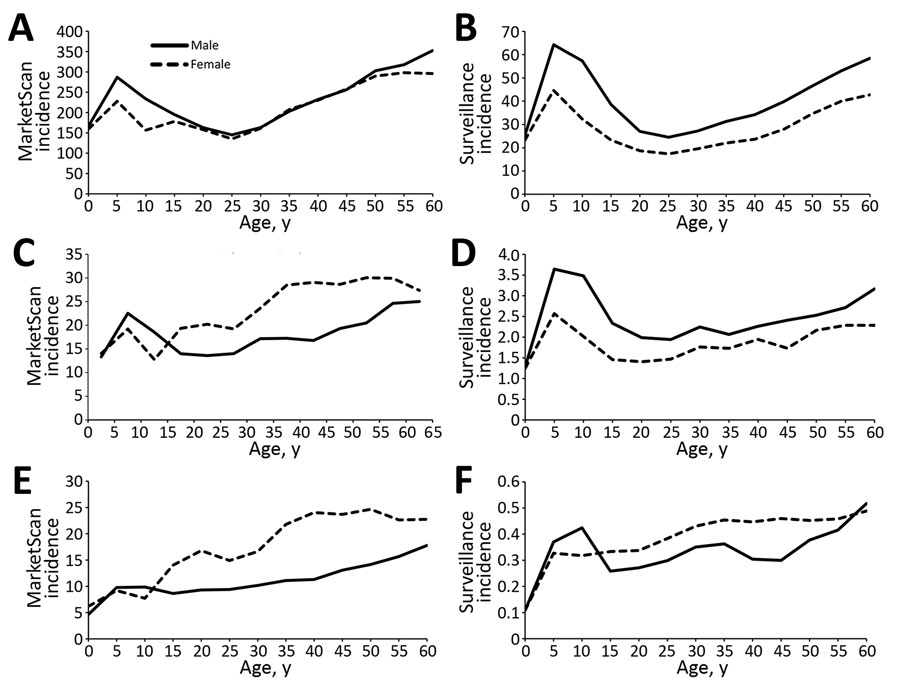
Figure 4. Lyme disease incidence by age group and sex in MarketScan enrollees (A, C, E) and from surveillance (B, D, F) by geographic category of Lyme disease endemicity (A– B, high-incidence states; C–D, neighboring states; E–F, low-incidence states), United States, 2010–2018. Incidence was calculated as diagnoses/100,000 enrollees in MarketScan or cases/100,000 population among each subcategory. Scales for each y-axis differ substantially to underscore overall age-related incidence patterns but do not permit direct comparison of the magnitude of Lyme disease between systems or geographic categories.
Page created: December 10, 2020
Page updated: January 23, 2021
Page reviewed: January 23, 2021
The conclusions, findings, and opinions expressed by authors contributing to this journal do not necessarily reflect the official position of the U.S. Department of Health and Human Services, the Public Health Service, the Centers for Disease Control and Prevention, or the authors' affiliated institutions. Use of trade names is for identification only and does not imply endorsement by any of the groups named above.