Volume 27, Number 3—March 2021
Dispatch
Human Infection with Eurasian Avian-Like Swine Influenza A(H1N1) Virus, the Netherlands, September 2019
Anna Parys, Elien Vandoorn, Jacqueline King, Annika Graaf, Anne Pohlmann, Martin Beer, Timm Harder, and Kristien Van Reeth
Figure
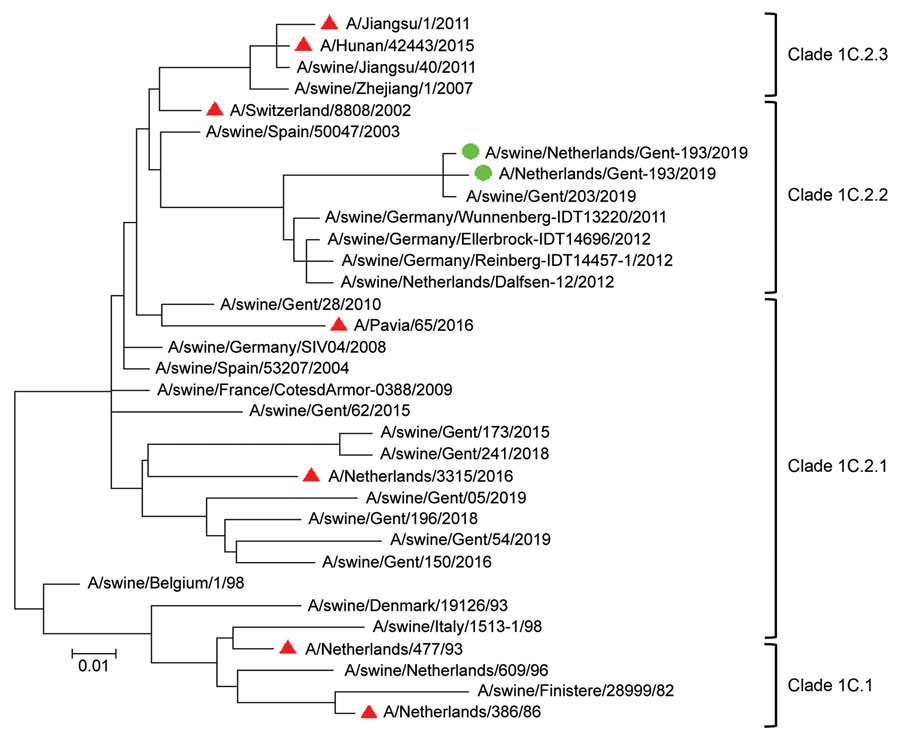
Figure. Phylogenetic tree based on amino acid sequences of the hemagglutinin 1 of Eurasian avian-like swine influenza A(H1N1) virus isolates from a pig farmer and his pigs (green circles), the Netherlands, and reference sequences (see [[ANCHOR###T2###Table 2###Anchor]]). Red triangles indicate reference sequences from humans. Phylogenetic relationships were estimated by using the maximum-likelihood method in MEGA7 software (https://www.megasoftware.net) and the Jones-Taylor-Thornton substitution model with a gamma distribution of among-site rate. Branch length is proportional to genetic distance. Scale bar indicates amino acid substitutions per site.
Page created: December 10, 2020
Page updated: February 21, 2021
Page reviewed: February 21, 2021
The conclusions, findings, and opinions expressed by authors contributing to this journal do not necessarily reflect the official position of the U.S. Department of Health and Human Services, the Public Health Service, the Centers for Disease Control and Prevention, or the authors' affiliated institutions. Use of trade names is for identification only and does not imply endorsement by any of the groups named above.