Volume 27, Number 3—March 2021
Research
Local and Travel-Associated Transmission of Tuberculosis at Central Western Border of Brazil, 2014–2017
Figure 2
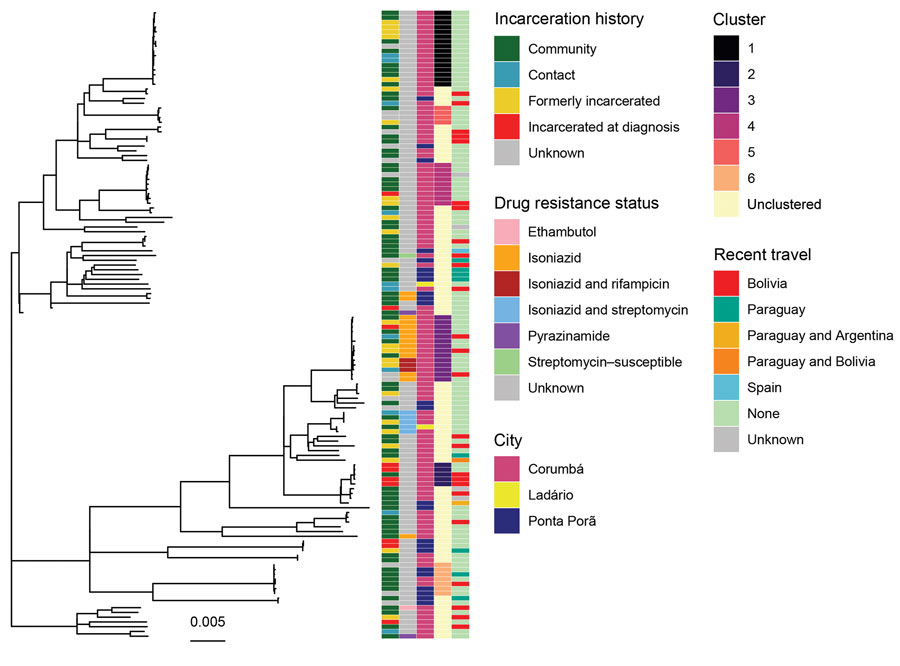
Figure 2. Unrooted maximum-likelihood phylogeny of 132 Mycobacterium tuberculosis isolates from Central West Brazil, 2014–2017, inferred from a multiple alignment of 6,590 single-nucleotide polymorphisms. From left, columns are colored by patient’s incarceration history, drug-resistance status, city, predicted transmission cluster, and recent travel history. Incarceration history is defined by responses to the study questionnaire and incarceration information in the tuberculosis registry; community includes patients who have not been incarcerated at the time of tuberculosis notification; contact indicates any reported contact with incarcerated persons; formerly incarcerated includes patients who report incarceration prior to their tuberculosis notification; and incarcerated at diagnosis includes patients notified at time of incarceration. Transmission cluster membership is shown for clusters with >4 isolates; all other isolates are labeled as unclustered. Scale bar indicates substitutions per site.
1These authors contributed equally to this article.
2These authors contributed equally to this article.