Volume 27, Number 3—March 2021
Dispatch
Trends in Untreated Tuberculosis in Large Municipalities, Brazil, 2008–2017
Figure 2
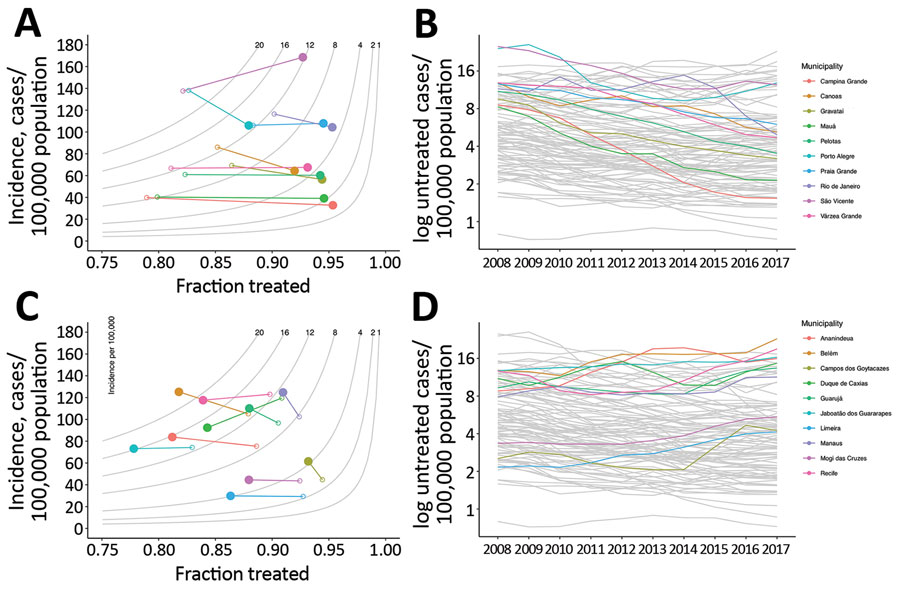
Figure 2. Municipalities of Brazil with the greatest decreases and increases in untreated tuberculosis (TB), 2008–2017. A, B) The 10 municipalities with the greatest decrease in untreated TB, showing the difference between modeled incidence and fraction treated (panel A) and time series of untreated TB (B). C) The 10 municipalities of Brazil with the greatest increase in untreated TB, showing the difference in modeled incidence of TB and fraction treated (C) and time series of untreated TB (D). In panels A and C, gray lines represent isopleths of untreated TB rate per 100,000 population, measured as the product of incidence and (1 − fraction treated); open circles indicate 2008 values, solid circles 2017 values. In panels B and D, gray lines represent other municipalities for comparison.