Volume 27, Number 4—April 2021
Dispatch
Persistence of SARS-CoV-2 N-Antibody Response in Healthcare Workers, London, UK
Figure
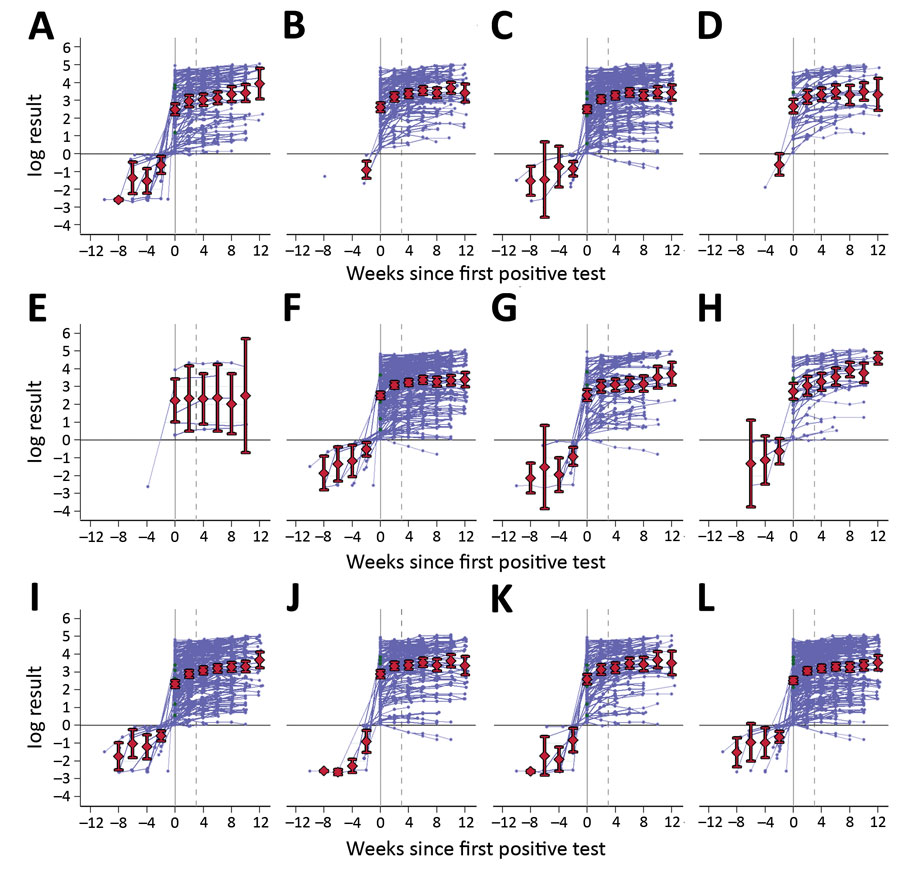
Figure. log antibody titers over time in participants with >1 positive test result by subgroups in study of nucleocapsid-antibody response in healthcare workers, London, UK. Subgroups are as follows: A) no self-reported illness (n = 99), B) coronavirus disease (COVID-19) diagnosis (n = 94), C) respiratory illness (n = 175), D) other illness (n = 43), E) immunocompromised (n = 6), F) general hospital employee (n = 204), G) emergency department employee (n = 71), H) intensive care unit employee (n = 38), I) age <40 years (n = 185), J) age >40 years (n = 127), K) male sex (n = 95), L) female sex (n = 217). Times are with respect to the date of the first positive test (week 0), and week 4 is indicated by dashed lines; previous negative results are also included. Individual responses are indicated by blue lines; mean titers with 95% CI for the mean are shown in red.