Volume 27, Number 4—April 2021
Dispatch
SARS-CoV-2 Seropositivity among US Marine Recruits Attending Basic Training, United States, Spring–Fall 2020
Figure 2
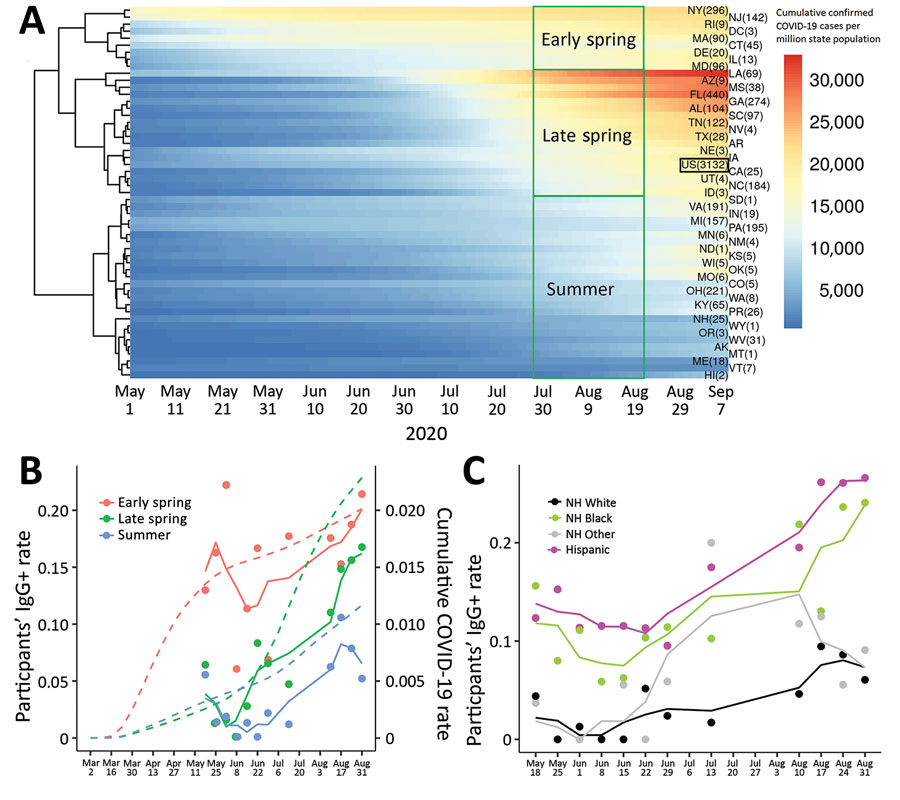
Figure 2. Confirmed COVID-19 and severe acute respiratory syndrome coronavirus 2 (SARS-CoV-2) IgG-positivity by state, race, and ethnicity, in a study of US Marine recruits, May 11–September 7, 2020. A) Heatmap of cumulated confirmed COVID-19 cases normalized by each state’s population. Each row represents 1 state, and number in parentheses indicates number of participants. Color reflects cumulative PCR-confirmed cases per 1 million state population (data obtained from COVID-19 Data Repository by the Center for Systems Science and Engineering at Johns Hopkins University, https://github.com/CSSEGISandData/COVID-19). Each column indicates 1 day during May 1–September 7, 2020. The US in aggregate is shown in the black box. B) SARS-CoV-2 IgG-seropositivity rate by week of enrollment on the basis of state groupings. Colored dots indicate the weekly IgG-positivity rate for study participants grouped by state; colored solid lines show 3-week running means. Dotted lines indicate cumulative PCR-confirmed COVID-19 cases in each state grouping obtained from COVID-19 Data Repository, including data before the study commenced. C) SARS-CoV-2 IgG-positivity by race and ethnicity. Colored dots indicate weekly IgG-positivity rate for study participants; colored solid lines indicate 3-week running means. Because of the relatively small number of participants in the first study week (May 11), they are merged into May 18 data. COVID-19, coronavirus disease; NH, Non-Hispanic.