Volume 27, Number 6—June 2021
Dispatch
Trends in Viral Respiratory Infections During COVID-19 Pandemic, South Korea
Sujin Yum, Kwan Hong, Sangho Sohn, Jeehyun Kim, and Byung Chul Chun
Figure
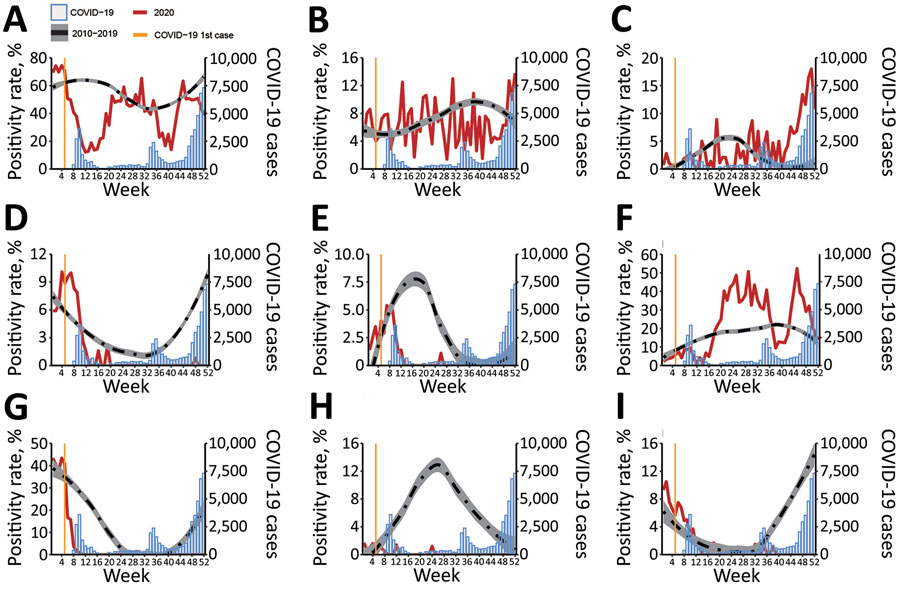
Figure. Mean weekly positivity rates for 8 respiratory viruses, South Korea, 2010–2019 compared with 2020. Vertical yellow line indicates the week of the first COVID-19 case in South Korea (i.e., the 5th week of 2020). Red line indicates weekly viral positivity rate in 2020. Blue bars show reported COVID-19 cases (Korean Ministry of Health and Welfare, http://ncov.mohw.go.kr/en). Dashed line indicates mean weekly positivity rates during 2010–2019 (data smoothed using the Loess method); gray shading indicates 95% CI. A) Total. B) Adenovirus. C) Human bocavirus. D) Human coronavirus. E) Human metapneumovirus. F) Human rhinovirus. G) Influenza virus. H) Human parainfluenza virus. I) Respiratory syncytial virus. COVID-19, coronavirus disease.
Page created: April 13, 2021
Page updated: May 18, 2021
Page reviewed: May 18, 2021
The conclusions, findings, and opinions expressed by authors contributing to this journal do not necessarily reflect the official position of the U.S. Department of Health and Human Services, the Public Health Service, the Centers for Disease Control and Prevention, or the authors' affiliated institutions. Use of trade names is for identification only and does not imply endorsement by any of the groups named above.