Emergence of SARS-CoV-2 Delta Variant, Benin, May–July 2021
Anges Yadouleton
1, Anna-Lena Sander
1, Praise Adewumi, Edmilson F. de Oliveira Filho, Carine Tchibozo, Gildas Hounkanrin, Keke K. René, Dossou Ange, Rodrigue K. Kohoun, Ramalia Chabi Nari, Sourakatou Salifou, Raoul Saizonou, Clement G. Kakai, Sonia V. Bedié, Fattah Al Onifade, Michael Nagel, Melchior A. Joël Aïssi, Petas Akogbeto, Christian Drosten, Ben Wulf, Andres Moreira-Soto, Mamoudou Harouna Djingarey, Benjamin Hounkpatin, and Jan Felix Drexler

Author affiliations: Laboratoire des Fièvres Hémorragiques Virales du Benin, Cotonou, Benin (A. Yadouleton, P. Adewumi, C. Tchibozo, G. Hounkanrin, R.C. Nari); Université Nationale des Sciences, Technologies, Ingénierie et Mathématiques, Abomey, Benin (A. Yadouleton, P. Adewumi, C. Tchibozo, G. Hounkanrin); Charité–Universitätsmedizin Berlin, Berlin, Germany (A.-L. Sander, E.F. de Oliveira Filho, C. Drosten, B. Wulf, A. Moreira-Soto, J.F. Drexler); Ministry of Health, Cotonou, Benin (K.K. René, D. Ange, R.K. Kohoun, S. Salifou, P. Akogbeto, B. Hounkpatin); Organisation mondiale de la Santé Cotonou, Contonou (R. Saizonou, C.G. Kakai, S.V. Bedié, F. Al Onifade, M.A. Joël Aïssi, M.H. Djingarey); Deutsche Gesellschaft für Internationale Zusammenarbeit, Bonn, Germany (M. Nagel); German Centre for Infection Research, Berlin, Germany (C. Drosten, J.F. Drexler); World Health Organization Regional Office for Africa, Brazzaville, Congo (M.H. Djingarey)
Main Article
Figure 2

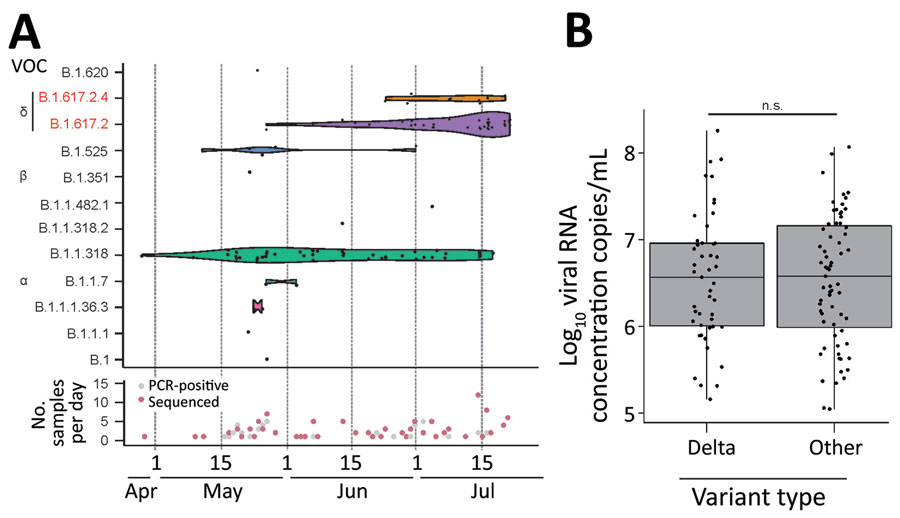
Figure 2. Virologic data on SARS-CoV-2 variants from respiratory samples, Benin, 2021. A) Top Gaussian kernel smoothed violins representing the density of observed occurrences per SARS-CoV-2 lineage at a given time point during the sampling period from the end of April until mid-July 2021. Black dots represent lineage occurrences of 114 generated genomes. Height of the violin plot corresponds to density of lineage in time. Bottom of graph shows collection date of the 200 SARS-CoV-2–positive samples collected for this study. Red indicates the subset for which near-full genomes were generated. Both plots were generated using the ggplot2 package in R (R Foundation for Statistical Computing, https://www.r-project.org). B) Log10 SARS-CoV-2 RNA concentrations of Delta variant strains versus all other lineages. Points represent each individual Log10 concentration. Box plots indicate interquartile range; whiskers represent the maximum and minimum values; horizontal line indicates the median. Plot was generated using the ggplot2 package in R. NS, not statistically significant by Student t-test; SARS-CoV-2, severe acute respiratory syndrome coronavirus 2; VOC, variant of concern.
Main Article
Page created: September 29, 2021
Page updated: December 20, 2021
Page reviewed: December 20, 2021
The conclusions, findings, and opinions expressed by authors contributing to this journal do not necessarily reflect the official position of the U.S. Department of Health and Human Services, the Public Health Service, the Centers for Disease Control and Prevention, or the authors' affiliated institutions. Use of trade names is for identification only and does not imply endorsement by any of the groups named above.
