Volume 28, Number 10—October 2022
Research
Improving Estimates of Social Contact Patterns for Airborne Transmission of Respiratory Pathogens
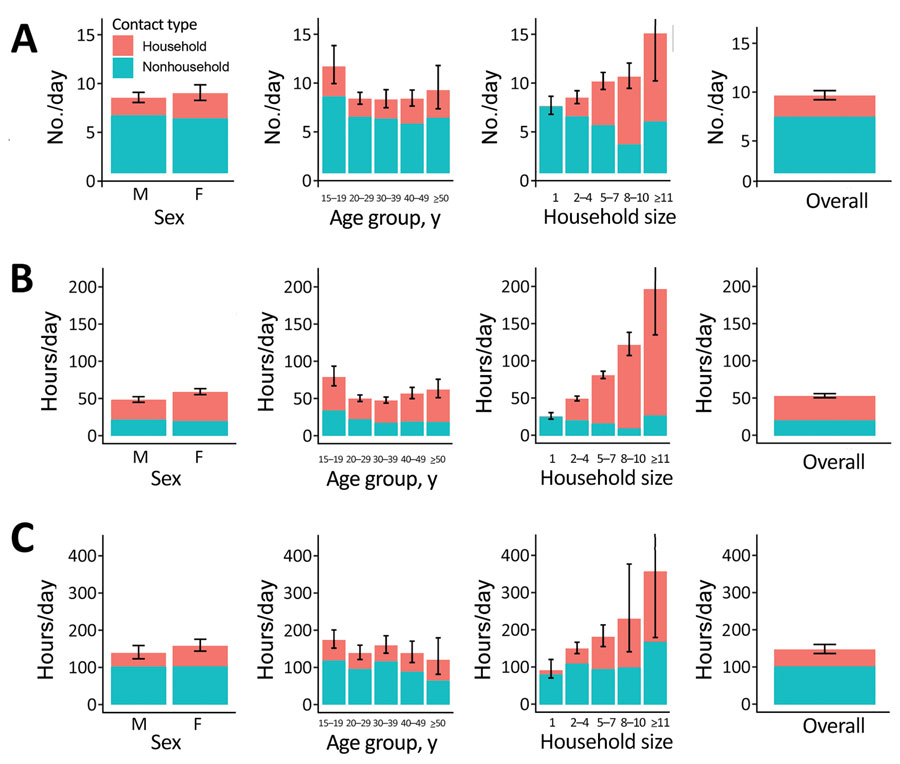
Figure 3

Figure 3. Household and nonhousehold close contact numbers (A), close contact time (B), and casual contact time (C) in Western Cape Province, South Africa, by sex, age, and household size, for study of social contact patterns for airborne transmission of respiratory pathogens. Error bars show 95% CIs for total contact numbers or time. In Western Cape, contact with household members was reported by a small proportion of respondents who had reported having no household members, most likely reflecting errors in the data.
Page created: August 15, 2022
Page updated: September 20, 2022
Page reviewed: September 20, 2022
The conclusions, findings, and opinions expressed by authors contributing to this journal do not necessarily reflect the official position of the U.S. Department of Health and Human Services, the Public Health Service, the Centers for Disease Control and Prevention, or the authors' affiliated institutions. Use of trade names is for identification only and does not imply endorsement by any of the groups named above.