Skip directly to site content Skip directly to page options Skip directly to A-Z link Skip directly to A-Z link Skip directly to A-Z link
Volume 28, Number 11—November 2022
Research Letter

Environmental Investigation during Legionellosis Outbreak, Montérégie, Quebec, Canada, 2021

Laura AtikesséComments to Author , Nabila Kadaoui, Vincent Lavallée, Éric Levac, Marie St-Amour, and François Milord
Author affiliations: Centre intégré de santé et de services sociaux de la Montérégie-Centre, Longueuil, Quebec, Canada (L. Atikessé, N. Kadaoui, V. Lavallée, É. Levac, M. St-Amour, F. Milord); Université de Sherbrooke, Longueuil (N. Kadaoui, É. Levac, M. St-Amour, F. Milord); Public Health Agency of Canada, Ottawa, Ontario, Canada (V. Lavallée)

Main Article

Figure

Wind rose profiles during each patient’s exposure period used in environmental investigation for legionellosis outbreak, Montérégie, Quebec, Canada, 2021. A–G) Cases C1–C7. Center crosshairs indicate center of the target area for each case; radii indicate percentage of frequency of winds over a time period, plotted by wind direction, with color bands showing wind speed ranges. Median and calm windspeeds are indicate for exposure times for each case. We calculated wind rose profiles for each of 7 case-patients during the time they were likely exposed. Wind rose profiles were generated by using meteorological data from High Resolution Deterministic Prediction System (HRDPS) modeling. Most case-patients, C1–C3 (panels A–C), C6 (panel G), and C7 (panel F), resided in the outbreak neighborhood; cases C4 (panel D) and C5 (panel E) were only in the area for a few hours, enabling more discriminating assessment of the possible exposures. C, case.

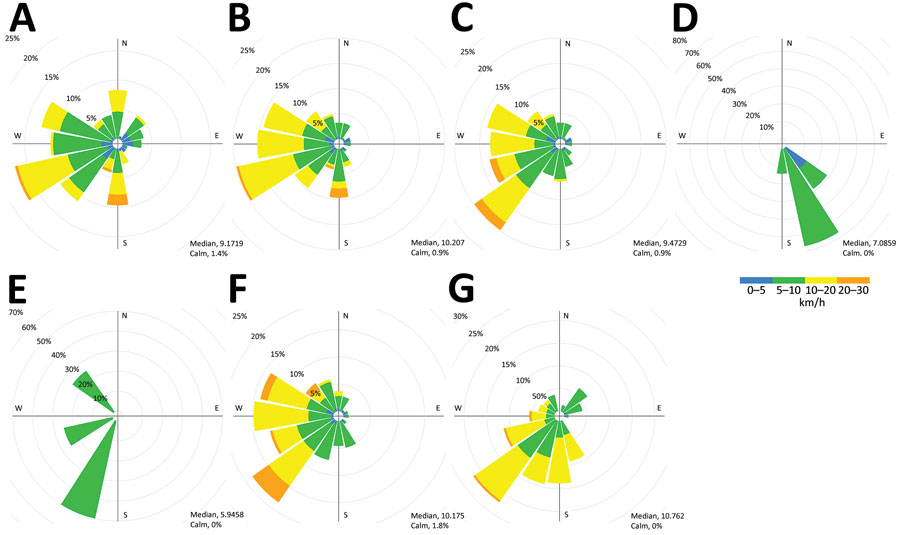
Figure. Wind rose profiles during each patient’s exposure period used in environmental investigation for legionellosis outbreak, Montérégie, Quebec, Canada, 2021. A–G) Cases C1–C7. Center crosshairs indicate center of the target area for each case; radii indicate percentage of frequency of winds over a time period, plotted by wind direction, with color bands showing wind speed ranges. Median and calm windspeeds are indicate for exposure times for each case. We calculated wind rose profiles for each of 7 case-patients during the time they were likely exposed. Wind rose profiles were generated by using meteorological data from High Resolution Deterministic Prediction System (HRDPS) modeling. Most case-patients, C1–C3 (panels A–C), C6 (panel G), and C7 (panel F), resided in the outbreak neighborhood; cases C4 (panel D) and C5 (panel E) were only in the area for a few hours, enabling more discriminating assessment of the possible exposures. C, case.

Main Article

Page created: October 06, 2022
Page updated: October 24, 2022
Page reviewed: October 24, 2022
The conclusions, findings, and opinions expressed by authors contributing to this journal do not necessarily reflect the official position of the U.S. Department of Health and Human Services, the Public Health Service, the Centers for Disease Control and Prevention, or the authors' affiliated institutions. Use of trade names is for identification only and does not imply endorsement by any of the groups named above.
file_external