Volume 28, Number 4—April 2022
Research
Mapping the Risk for West Nile Virus Transmission, Africa
José-María García-Carrasco , Antonio-Román Muñoz, Jesús Olivero, Marina Segura, and Raimundo Real
Figure 3
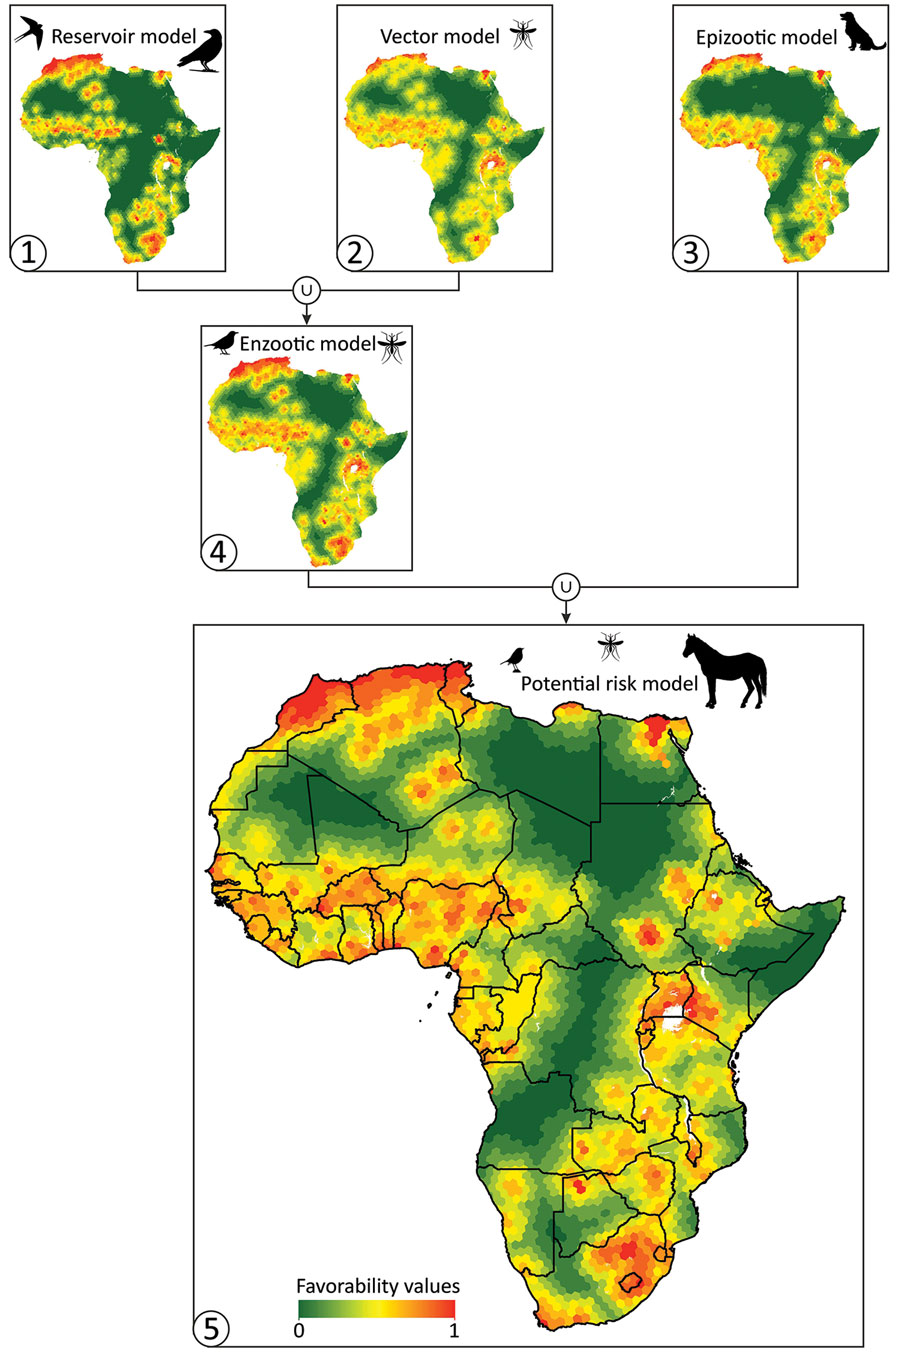
Figure 3. Cartographic representation of the biogeographic models (numbered 1–5) based on the different West Nile virus lifecycle components for Africa. Model 1 (reservoir model) indicates environmental favorability for the presence of the virus in birds. Model 2 (vector model) indicates environmental favorability for the presence of the virus in vectors. Model 3 (epizootic model) indicates environmental favorability for the presence of the virus in nonhuman mammals. Model 4 (enzootic model) indicates environmental favorability for the presence of the virus in >1 component of the enzootic virus cycle. Model 5 (potential risk model) indicates environmental favorability for potential spillover of the virus.
Page created: January 27, 2022
Page updated: March 19, 2022
Page reviewed: March 19, 2022
The conclusions, findings, and opinions expressed by authors contributing to this journal do not necessarily reflect the official position of the U.S. Department of Health and Human Services, the Public Health Service, the Centers for Disease Control and Prevention, or the authors' affiliated institutions. Use of trade names is for identification only and does not imply endorsement by any of the groups named above.