Volume 28, Number 4—April 2022
Research
Decrease in Tuberculosis Cases during COVID-19 Pandemic as Reflected by Outpatient Pharmacy Data, United States, 2020
Figure 2
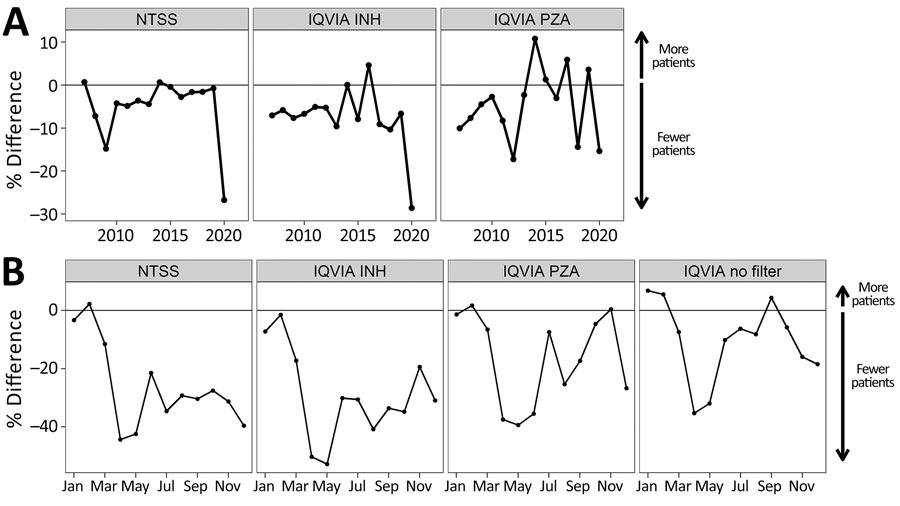
Figure 2. Comparison between 2020 tuberculosis case counts and case counts in previous years, United States. A) Percentage difference in case counts each year compared to previous years. NTSS case counts were aggregated by treatment start date month. A moving annual total ending in December was used for the number of projected patients in the IQVIA (https://www.iqvia.com) dataset prescribed INH or PZA. The horizontal black line indicates a percent change of zero, indicating no change in the number of cases from the previous year; above the line indicates more patients than the previous year and below the line fewer. B) Percent difference in prescriptions between 2019 and 2020 by month. NTSS case counts were aggregated by treatment start date month, whereas IQVIA data were aggregated by New to Brand prescription data for INH prescriptions, PZA prescriptions, or no filter applied. The horizontal black line represents no change in 2020 compared with 2019; above the line means more prescriptions in 2020 and below indicates fewer. The same analysis was also conducted for IQVIA projected patient counts (Appendix Figure 4). INH, isoniazid; NTSS, National Tuberculosis Surveillance System; PZA, pyrazinamide.