Skip directly to site content Skip directly to page options Skip directly to A-Z link Skip directly to A-Z link Skip directly to A-Z link
Volume 28, Number 5—May 2022
Dispatch

Duration of Infectious Virus Shedding by SARS-CoV-2 Omicron Variant–Infected Vaccinees

Kenichiro Takahashi1, Masahiro Ishikane1Comments to Author , Mugen Ujiie, Noriko Iwamoto, Nobumasa Okumura, Testsuro Sato, Maki Nagashima, Ataru Moriya, Michiyo Suzuki, Masayuki Hojo, Takayuki Kanno, Shinji Saito, Sho Miyamoto, Akira Ainai, Minoru Tobiume, Takeshi Arashiro, Tsuguto Fujimoto, Tomoya Saito, Masaya Yamato, Tadaki SuzukiComments to Author , and Norio Ohmagari
Author affiliations: National Institute of Infectious Diseases, Tokyo, Japan (K. Takahashi, T. Kanno, S. Saito, S. Miyamoto, A. Ainai, M. Tobiume, T. Arashiro, T. Fujimoto, T. Saito, T. Suzuki); National Center for Global Health and Medicine, Tokyo (M. Ishikane, M. Ujiie, N. Iwamoto, N. Okumura, T. Sato, M. Nagashima, A. Moriya, M. Suzuki, M. Hojo, N. Ohmagari); Rinku General Medical Center, Osaka, Japan (M. Yamato)

Main Article

Figure 2

SARS-CoV-2 RNA level and infectious virus shedding in upper respiratory samples from symptomatic patients infected with the SARS-CoV-2 Omicron variant, Japan, November 29–December 18, 2021. A) SARS-CoV-2 RNA levels and presence of the infectious virus, by date of symptom onset. Each closed circle indicates case-patients from whom virus was isolated. Numbers above each plot indicate the proportion of case-patients from whom virus was isolated in each period. Black lines indicate median Cq values and error bars interquartile ranges; dotted lines indicate negative cutoff values. *Before symptom onset. B) SARS-CoV-2 RNA levels and presence of infectious virus, by date of symptom resolution. Closed circles indicate patients from whom virus was isolated. Numbers above each plot indicate the proportion of persons from whom virus was isolated in each period. Black lines indicate median Cq values and error bars interquartile ranges; dotted lines indicate cutoff values. †Before symptom resolution. Cq, quantification cycle; SARS-CoV-2, severe acute respiratory syndrome coronavirus 2.

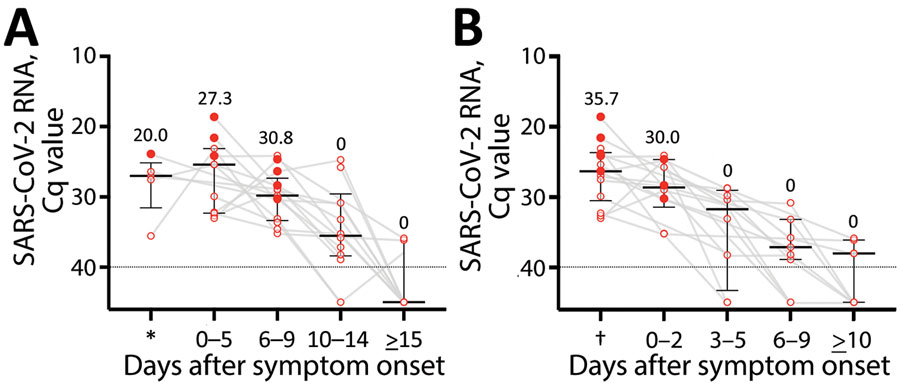
Figure 2. SARS-CoV-2 RNA level and infectious virus shedding in upper respiratory samples from symptomatic patients infected with the SARS-CoV-2 Omicron variant, Japan, November 29–December 18, 2021. A) SARS-CoV-2 RNA levels and presence of the infectious virus, by date of symptom onset. Each closed circle indicates case-patients from whom virus was isolated. Numbers above each plot indicate the proportion of case-patients from whom virus was isolated in each period. Black lines indicate median Cq values and error bars interquartile ranges; dotted lines indicate negative cutoff values. *Before symptom onset. B) SARS-CoV-2 RNA levels and presence of infectious virus, by date of symptom resolution. Closed circles indicate patients from whom virus was isolated. Numbers above each plot indicate the proportion of persons from whom virus was isolated in each period. Black lines indicate median Cq values and error bars interquartile ranges; dotted lines indicate cutoff values. †Before symptom resolution. Cq, quantification cycle; SARS-CoV-2, severe acute respiratory syndrome coronavirus 2.

Main Article

1These authors contributed equally to this article.

Page created: March 15, 2022
Page updated: May 31, 2022
Page reviewed: May 31, 2022
The conclusions, findings, and opinions expressed by authors contributing to this journal do not necessarily reflect the official position of the U.S. Department of Health and Human Services, the Public Health Service, the Centers for Disease Control and Prevention, or the authors' affiliated institutions. Use of trade names is for identification only and does not imply endorsement by any of the groups named above.
file_external