Volume 28, Number 6—June 2022
Research
Economic Burden of Reported Lyme Disease in High-Incidence Areas, United States, 2014–2016
Cite This Article
Citation for Media
Abstract
Approximately 476,000 cases of Lyme disease are diagnosed in the United States annually, yet comprehensive economic evaluations are lacking. In a prospective study among reported cases in Lyme disease–endemic states, we estimated the total patient cost and total societal cost of the disease. In addition, we evaluated disease and demographic factors associated with total societal cost. Participants had a mean patient cost of ≈$1,200 (median $240) and a mean societal cost of ≈$2,000 (median $700). Patients with confirmed disseminated disease or probable disease had approximately double the societal cost of those with confirmed localized disease. The annual, aggregate cost of diagnosed Lyme disease could be $345–968 million (2016 US dollars) to US society. Our findings emphasize the importance of effective prevention and early diagnosis to reduce illness and associated costs. These results can be used in cost-effectiveness analyses of current and future prevention methods, such as a vaccine.
Lyme disease is a bacterial illness caused primarily by infection with Borrelia burgdorferi, transmitted by the bite of infected Ixodes scapularis and I. pacificus ticks in the United States. Early symptoms can include a rash known as erythema migrans and influenza-like symptoms (1). Disseminated infection can cause neurologic, musculoskeletal, and cardiac complications; in rare cases, cardiac involvement can be fatal (1–4). Most patients will experience a full recovery after antibiotic treatment, although a minority may continue to experience symptoms related to disease sequelae (1).
Lyme disease case numbers consistently rank in the top 10 among all nationally notifiable conditions, and it is the most commonly reported vector-borne disease in the United States (4,5). Annually, >30,000 cases are reported to the Centers for Disease Control and Prevention (4), but recent studies have demonstrated that the annual number of diagnosed cases is ≈476,000 (6). This figure represents a substantial disease burden, but the total economic cost to US society is unknown (7).
Economic evaluations for Lyme disease have limitations (7). Most studies report direct medical costs but lack data on nonmedical costs and losses in productivity (8–11). Several studies were conducted >2 decades ago in a few Maryland counties where Lyme disease was emerging (9,11,12); however, this limited scope prevents generalizability to other areas in which the disease is endemic, and results might not be representative of today’s costs because of changes in disease management and healthcare structures. More recent studies have used diagnosis codes (e.g., International Classification of Diseases, 9th Revision, Clinical Modification) to identify Lyme disease patients from insurance claims databases. However, the low sensitivity and specificity of these codes in identifying actual cases (13,14) might lead to incorrect estimates of direct medical costs attributable to the disease. The few studies that provide more comprehensive cost estimates of Lyme disease were conducted in Europe under healthcare systems with financing structures different from those of the United States (15–17). As such, updated estimates of the total societal cost of Lyme disease, including direct and indirect costs, are needed in the United States (7).
We aimed to address current research gaps by conducting a prospective cost-of-illness study to estimate the economic burden of reported Lyme disease in high-incidence areas of the United States. The main objectives of this study were to estimate the patient cost and the societal cost per participant. The secondary objective was to evaluate the association of select disease and demographic factors with the societal cost per participant. Results can be used by public health officials and communities to assess the cost-effectiveness of interventions to reduce the incidence of Lyme disease.
Study Design
This study was conducted as part of TickNET, a public health network of researchers who collaborate on tickborne disease research and surveillance (18). We conducted a prospective cost-of-illness study to estimate total costs per patient caused by Lyme disease in 4 high-incidence states: Connecticut, Maryland, Minnesota, and New York. We used an incidence-based design, measuring the cost of illness from onset to conclusion (19,20). We analyzed these costs from the patient perspective (i.e., costs incurred by the patient) and the societal perspective (i.e., costs incurred by the patient, healthcare system, or third-party payer) (21,22). Cost categories included direct medical costs (clinician visits, procedures, diagnostic testing, therapy, hospitalization, emergency department visits, or other relevant costs); direct nonmedical costs (roundtrip travel costs for healthcare visits and amount paid for assistance with self-care, dependent care, or house or yard maintenance because of Lyme disease); and indirect costs, which are the cost of productivity losses (time taken off work or school because of symptoms or healthcare visits) (Appendix Table 1) (23). Henceforth, we will refer to direct medical costs as either patient medical costs (for medical costs borne by the patient) or societal medical costs (for total medical costs borne by the patient, healthcare system, and third-party payer); in addition, we will refer to direct nonmedical costs as nonmedical costs.
Study Population
The source population included pediatric and adult patients with clinician-diagnosed Lyme disease reported to public health surveillance authorities in Connecticut and Minnesota and in select counties in Maryland and New York (Appendix Table 2). Eligible patients met the national surveillance case definition for confirmed or probable disease during the study period and were referred by surveillance authorities to study personnel upon case classification (24). To ensure enrollment of incident cases only, we excluded the following cases: probable cases with no symptoms reported by the clinician, cases with a previous Lyme disease diagnosis within 2 calendar years of current diagnosis date, and cases with a diagnosis date >12 months before date of enrollment. Non–English-speaking patients were not enrolled because of limited resources for interpreters.
We classified eligible patients into 3 disease categories. Those with confirmed Lyme disease were divided into 2 groups: confirmed localized disease (i.e., those with erythema migrans) and confirmed disseminated disease (i.e., those with arthritis, lymphocytic meningitis, cranial neuritis or facial palsy, radiculoneuropathy, encephalomyelitis, or second- or third-degree heart block) (24). The third category included probable cases with symptoms reported by a clinician. To ensure enrollment of participants with a range of disease severity, we stratified recruitment by disease category and, using quota sampling, aimed to recruit approximately equal numbers of participants in each category each month. This strategy also enabled us to enroll participants as close to their diagnosis date as possible to reduce participant recall error regarding costs. Each state aimed to enroll a minimum of 50 participants per disease category; the overall minimum enrollment goal was 150 total participants per state. Recruitment and enrollment occurred during September 2014–January 2016.
Data Collection
Participants consented to data collection for either patient costs or societal costs. Study coordinators conducted introductory telephone-based surveys with participants (or legal guardians for pediatric participants) to collect data on age, sex, annual household income, insurance coverage, and disease onset date. Patient cost data were collected at the introductory survey and then approximately monthly by using the IBM SPSS Data Collection Web Interviews survey program (IBM, https://www.ibm.com). We collected the following data on all surveys: dates for Lyme disease–related healthcare visits, clinician contact information, patient medical costs, nonmedical costs, and productivity losses. Surveys ceased when participants reported no Lyme disease–related expenses for 2 consecutive surveys or when they completed the maximum of 12 surveys.
To calculate societal medical costs, we requested billing codes (i.e., Current Procedural Terminology [CPT], 4th Edition) directly from participants’ clinicians. We requested codes from 1 month before the self-reported disease onset date to the date of the final survey. We used a date range instead of individual visit dates reported by the participant in the event participants had incorrectly reported dates. We extracted mean reimbursement for each CPT code collected for participants with private insurance from IBM MarketScan Research Databases (IBM), which include national medical claims data for privately insured persons <65 years of age and their dependents, and reimbursements for CPT codes collected for nonprivately insured participants from the Physician Fee Schedule from the Centers for Medicare and Medicaid Services (25). We extracted the costs of reimbursements according to state, year, and inpatient versus outpatient status (Appendix).
Analysis
To provide an overall weighted mean and median set of reimbursements and costs, disease category sampling probabilities were estimated from disease category proportions derived from surveillance data (4) to approximate stratified random sampling. We then used the inverse of the sampling probabilities to weight the data for all analyses described. We excluded participants who did not complete 3 consecutive surveys from all analyses. We adjusted medical costs to 2016 US dollars by using the Consumer Price Index for medical care and the general Consumer Price Index for nonmedical costs and costs of productivity losses (26). We estimated the mean, median, 10th and 90th percentiles, and SDs of patient costs, societal medical costs, and total societal costs per participant. We used the Kruskal-Wallis rank-sum test to evaluate differences in cost among the 3 disease categories (confirmed localized, confirmed disseminated, probable).
To estimate the patient cost, we summed self-reported patient medical costs, nonmedical costs, and cost of productivity losses over all surveys per participant (Appendix). To calculate the societal medical costs, we summed the mean cost per CPT code collected for each participant (Appendix). Finally, we calculated the societal cost by summing the societal medical costs, patient nonmedical costs, and cost of productivity losses per participant.
We conducted multivariable linear regression analysis by using the weighted dataset to evaluate associations between the societal cost per participant and the following independent variables: disease category (confirmed localized, confirmed disseminated, probable), age group (<18, 18–45, 46–65, >65 years of age), sex (male, female), and state (Connecticut, Maryland, Minnesota, New York). We controlled for insurance status (private or nonprivate insurance), income (<$60,000 or >$60,000, which was the approximate median household income for participating states in 2015) (27), and study year (2014, 2015, 2016). As is typical for healthcare cost data, the distribution of societal cost was highly skewed, resulting in heteroskedasticity of the residuals in the model (28). Therefore, we transformed societal cost per participant by using natural logarithms and conducted sampling-weighted least squares regression (Appendix).
We obtained research approval from institutional review boards at Centers for Disease Control and Prevention, Connecticut Department of Public Health, Maryland Department of Health, Minnesota Department of Health, New York State Department of Health, and Yale University. We conducted analyses using SAS version 9.4 (SAS Institute, https://www.sas.com) and R version 3.5.2 (29–34).
Figure 1
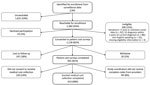
Figure 1. Flowchart of enrollment and completion by participants in study of economic burden of reported Lyme disease in high-incidence areas, United States, 2014–2016. LD, Lyme disease.
During the enrollment period, we identified 2,991 Lyme disease patients who were classified as having confirmed cases or probable cases with symptoms reported (Figure 1). Of the 1,360 (45%) patients we were able to contact, 1,118 (82%) consented to patient cost surveys; we included 901 (81%) participants with complete survey data in the patient cost analysis. Last, 613 (68%) of these participants also had complete societal medical cost data, and we included them in the societal cost analysis.
The study population included 402 (55%) confirmed localized, 238 (21%) confirmed disseminated, and 261 (24%) probable cases (Table 1). Overall, 36% of participants were 46–65 years of age, 57% were men, and 94% were white. Most had income >$60,000 (71%) and private health insurance (70%). Demographic distributions were similar for the 613 participants who completed both patient cost surveys and societal medical cost collection (Appendix Table 3).
Participants reported a median of 2 provider visits and completed a median of 3 surveys (Table 2). Those with confirmed disseminated disease had the highest number of provider visits, reflecting the highest healthcare use, whereas those with probable disease had the highest number of surveys completed, reflecting the longest duration of costs incurred. Forty (4%) participants were still reporting symptoms and 25 (3%) were still incurring costs at survey 12.
Overall, the patient cost per participant ranged from $0.46 to $30,628. The median cost was $244 and the mean cost $1,252, reflecting a highly positively skewed distribution (Table 3). Participants with confirmed disseminated Lyme disease had the highest median cost ($358) and mean cost ($1,692), followed by those with probable disease (median $315 and mean $1,277), then participants with confirmed localized disease (median $170 and mean $1,070).
Figure 2
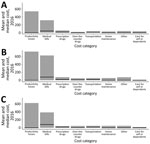
Figure 2. Mean and median cost per participant, by Lyme disease category and cost category of the total patient cost in high-incidence areas of the United States, 2014–2016. A) Confirmed localized disease;...
We calculated the median and mean cost per component of the patient cost by disease category (Figure 2; Appendix Table 4). For all disease categories, productivity losses had the highest mean cost of all cost components: $727 for those with confirmed disseminated disease, $627 for those with probable disease, and $540 for those with confirmed localized disease. However, the median cost of productivity losses for all disease categories was $0. Medical bills had the next highest cost: a median of $83 and a mean of $628 for those with confirmed disseminated disease, a median of $83 and a mean of $389 for those with probable disease, and a median of $42 and a mean of $314 for those with confirmed localized disease. All other cost components for all disease categories had median costs <$22 and mean costs <$80.
We collected 9,679 CPT codes to estimate societal medical costs. The most common codes were for office visits (17%) and routine venipuncture (6%) (Appendix Table 6). Overall, the societal medical cost per participant ranged from $50 to $121,869, for a median of $478 and mean of $1,333 (Table 4). Participants with confirmed disseminated disease had the highest median and mean societal medical cost ($696 and $2,537), followed by those with probable disease ($612 and $1,804), then confirmed localized disease ($374 and $668).
Overall, the societal cost of Lyme disease per participant ranged from $54 to $122,766; the median was $690 and the mean $2,032 (Table 5). Participants with confirmed disseminated disease had the highest median and mean societal cost ($1,081 and $3,251), followed by those with probable disease ($940 and $2,620), then confirmed localized disease ($493 and $1,307) (Appendix Table 7). Applying these per participant societal costs to estimates of the number of Lyme disease cases diagnosed each year (6), the aggregate cost to US society annually would be ≈$345 million using median costs and ≈$968 million using mean costs (2016 US dollars; Appendix Tables 9, 10).
In multivariable linear regression analysis, disease category, age, and state were associated with societal cost per participant (Table 6; Appendix Table 8). Costs for participants with confirmed disseminated disease were 120% higher than costs for participants with confirmed localized disease (p<0.001); participants with probable disease had costs that were 59% higher than for those with confirmed localized disease. Participants 18–45 and 46–65 years of age had costs that were 96% and 108% higher, respectively, than those <18 years of age (p<0.001); however, those >65 years of age did not have significantly different costs. Minnesota residents had 75% higher costs than did Connecticut residents, but Maryland and New York residents did not have significantly different costs from those for Connecticut residents.
In this study, persons with confirmed or probable Lyme disease had an average patient cost of ≈$1,200 (median cost ≈$240) and an average societal cost of ≈$2,000 (median cost ≈$700). In stratified analyses by disease category, those with confirmed disseminated or probable disease had double or more the societal cost per participant than those with confirmed localized disease, highlighting the importance of early and accurate diagnosis. Having disseminated or probable disease, being 18–65 years of age, and residing in Minnesota had the greatest effects on the societal cost of Lyme disease. Although median societal costs were typically <$1,000 for all disease categories, mean costs were substantially higher, indicating that most patients have low costs, but some experience very high costs related to this disease. Similarly, the low median number of provider visits and hours of lost productivity suggest that Lyme disease illness is manageable for most patients, but for a minority, it can be highly disruptive. Approximately 476,000 cases of Lyme disease are diagnosed each year in the United States, so the aggregate cost to society annually could be $345–968 million (2016 US dollars). This substantial economic burden underscores the need for effective prevention methods, such as a vaccine.
Classification of a reported case as probable means a clinician has diagnosed Lyme disease in a patient and laboratory evidence of infection exists. However, any reported symptoms are typically nonspecific and do not meet clinical criteria for a confirmed case (24). Further, laboratory evidence of infection includes single-tier IgG immunoblot seropositivity, which might indicate past, rather than current, infection. As such, the increased costs for probable cases might result from higher healthcare use for disease unrelated to Lyme disease, which highlights the need for improvements in Lyme disease diagnosis and clinician education.
In a geographically limited study of Lyme disease patients residing on the eastern shore of Maryland during 1998–2001, Zhang et al. (9) reported mean total costs of $3,494 and median total costs of $500 (2016 US dollars) per patient attributable to this disease. However, their case definition differed from ours in its inclusion of patients with early, late, and suspected disease, as well as those with tick bite and other related complaints, as identified using diagnosis codes in medical records. Therefore, these figures might not be directly comparable to our mean and median societal costs ($2,032 and $690). Zhang et al. reported mean and median total costs of $2,275 and $689 (2016 US dollars) for participants with clinically defined early disease, which are higher than what we found for confirmed localized disease (mean $1,307 and median $493). However, in regression analyses, Zhang et al. found that disease category and age, but not sex, were significantly associated with societal medical costs, similar to our findings for societal cost. In another US study using nationwide commercial insurance claims data to compare cases with matched controls during 2006–2010, Adrion et al. (8) estimated an increase of $3,009 (2016 US dollars) in societal medical costs attributable to Lyme disease over a 12-month period. That cost is higher than our overall mean societal medical cost ($1,333), likely because of study population differences, but is similar to that found for our participants with confirmed disseminated disease ($2,537). In a recent study in the Netherlands, Van den Wijngaard et al. (17) used a societal perspective to estimate a total cost of $137 for patients with erythema migrans only and $6,398 (2016 US dollars) for those with disseminated Lyme borreliosis. These costs are lower than those for our societal results for confirmed localized disease ($1,307) and higher than those for our societal results for confirmed disseminated disease ($3,251). These cost differences might result from different healthcare financing systems in the United States versus Europe or from variations in clinical manifestations resulting from infection with different B. burgdorferi sensu lato strains (15–17).
Our study adds to the scarce literature on the economic burden of Lyme disease and provides a comprehensive estimate of its costs to both the patient and society. In addition, our prospective collection of all patient costs, including nonmedical costs and productivity losses, enables more accurate and more comprehensive cost estimates compared with previous studies in the United States. Further, these results provide estimates of the cost savings per case averted, which can be used in cost-benefit analyses of prevention interventions, such as a potential vaccine.
The first limitation of our study is that our estimates might be affected by recall error, either by participants or providers, although we attempted to mitigate such error by enrolling patients as close to disease onset as possible, by surveying them monthly to capture ongoing costs, and by requesting codes from providers for a date range instead of for individual visits. However, by requesting codes over a date range, some billing codes unrelated to Lyme disease (e.g., for other comorbidities) might have been included despite our excluding codes definitively unrelated to Lyme disease, potentially leading to overestimates. Information bias might have occurred in our measure of association between disease category and cost because those with milder disease might be more likely to forget some costs than those with more severe disease, with a potential bias away from null. In addition, although the use of quota sampling to recruit reported cases was necessary to enroll patients near disease onset, this nonprobability sampling method limits our ability to meet assumptions for calculating sampling error. Use of surveillance data to weight responses by disease category was intended to ensure representativeness by disease category. Nevertheless, in surveillance data, confirmed localized cases are likely underreported, resulting in confirmed disseminated cases representing an artificially large proportion of cases; therefore, our overall cost might be overestimated (35,36). Finally, this study did not include costs related to deaths from Lyme disease, because no enrolled participants died. Although very rare, death from Lyme carditis has been reported (2,3), and associated productivity losses would greatly increase cost estimates.
Our results reflect the costs of diagnosed cases meeting the Lyme disease surveillance case definition in high-incidence states (24); as such, these costs likely reflect that of actual infections. However, we were not able to evaluate whether our estimates accurately represent the cost of diagnosed but unreported Lyme disease, cases that reflect some proportion of overdiagnosis (6). Further, our results might not reflect costs in states with emerging or low incidence of Lyme disease. Therefore, our results for extrapolation of costs to an estimated ≈476,000 diagnosed cases nationally per year should be interpreted with caution. Last, our results do not include costs for suspected Lyme disease (e.g., consultation and prophylactic treatment for tick bite, negative diagnostic tests), undiagnosed disease, or nonacute disease (e.g., patients experiencing long-term symptoms). These costs would further increase the total economic burden attributable to Lyme disease. Future efforts should include cost-effectiveness analyses of current and future prevention methods, such as a vaccine, in addition to economic evaluations of unreported, suspected, and nonacute disease.
In conclusion, Lyme disease represents a substantial economic burden to individual patients and US society. The aggregate cost of diagnosed Lyme disease could be nearly $1 billion annually, not including suspected, undiagnosed, or nonacute cases. These findings emphasize the importance of early and accurate diagnosis to reduce both illness and its associated personal and societal costs.
Dr. Hook is an epidemiologist in the Bacterial Diseases Branch, Division of Vector-Borne Diseases, National Center for Emerging and Zoonotic Infectious Diseases, Centers for Disease Control and Prevention, Fort Collins, Colorado. Her primary research interests are the epidemiology and prevention of bacterial vector-borne infections.
Acknowledgments
We thank Nadia Thomas, Shaylee Mehta, David Neitzel, Elizabeth Schiffman, Molly Peterson, Julie Ray, Jamie Sommer, Robert Heimer, Mark Lamias, Craig Mincic, and John Jones for their assistance in conducting this study; Brad Biggerstaff, Zach Weller, and Josh Keller for their statistical advice; and Paul Mead, Jennifer Peel, Jude Bayham, Sheryl Magzamen, and Brooke Anderson for their valuable insights during manuscript preparation.
This work was supported by the Centers for Disease Control and Prevention.
References
- Wormser GP, Dattwyler RJ, Shapiro ED, Halperin JJ, Steere AC, Klempner MS, et al. The clinical assessment, treatment, and prevention of lyme disease, human granulocytic anaplasmosis, and babesiosis: clinical practice guidelines by the Infectious Diseases Society of America. Clin Infect Dis. 2006;43:1089–134. DOIPubMedGoogle Scholar
- Forrester JD, Mead P. Third-degree heart block associated with lyme carditis: review of published cases. Clin Infect Dis. 2014;59:996–1000. DOIPubMedGoogle Scholar
- Forrester JD, Meiman J, Mullins J, Nelson R, Ertel SH, Cartter M, et al.; Centers for Disease Control and Prevention (CDC). Notes from the field: update on Lyme carditis, groups at high risk, and frequency of associated sudden cardiac death—United States. MMWR Morb Mortal Wkly Rep. 2014;63:982–3.PubMedGoogle Scholar
- Schwartz AM, Hinckley AF, Mead PS, Hook SA, Kugeler KJ. Surveillance for Lyme disease—United States, 2008–2015. MMWR Surveill Summ. 2017;66:1–12. DOIPubMedGoogle Scholar
- Rosenberg R, Lindsey NP, Fischer M, Gregory CJ, Hinckley AF, Mead PS, et al. Vital signs: trends in reported vectorborne disease cases—United States and territories, 2004–2016. MMWR Morb Mortal Wkly Rep. 2018;67:496–501. DOIPubMedGoogle Scholar
- Kugeler KJ, Schwartz AM, Delorey MJ, Mead PS, Hinckley AF. Estimating the frequency of Lyme disease diagnoses, United States, 2010–2018. Emerg Infect Dis. 2021;27:616–9. DOIPubMedGoogle Scholar
- Mac S, da Silva SR, Sander B. The economic burden of Lyme disease and the cost-effectiveness of Lyme disease interventions: A scoping review. PLoS One. 2019;14:
e0210280 . DOIPubMedGoogle Scholar - Adrion ER, Aucott J, Lemke KW, Weiner JP. Health care costs, utilization and patterns of care following Lyme disease. PLoS One. 2015;10:
e0116767 . DOIPubMedGoogle Scholar - Zhang X, Meltzer MI, Peña CA, Hopkins AB, Wroth L, Fix AD. Economic impact of Lyme disease. Emerg Infect Dis. 2006;12:653–60. DOIPubMedGoogle Scholar
- Strickland GT, Karp AC, Mathews A, Peña CA. Utilization and cost of serologic tests for Lyme disease in Maryland. J Infect Dis. 1997;176:819–21. DOIPubMedGoogle Scholar
- Fix AD, Strickland GT, Grant J. Tick bites and Lyme disease in an endemic setting: problematic use of serologic testing and prophylactic antibiotic therapy. JAMA. 1998;279:206–10. DOIPubMedGoogle Scholar
- Strickland GT, Caisley I, Woubeshet M, Israel E. Antibiotic therapy for Lyme disease in Maryland. Public Health Rep. 1994;109:745–9.PubMedGoogle Scholar
- Rutz H, Hogan B, Hook S, Hinckley A, Feldman K. Exploring an alternative approach to Lyme disease surveillance in Maryland. Zoonoses Public Health. 2018;65:254–9. DOIPubMedGoogle Scholar
- White J, Noonan-Toly C, Lukacik G, Thomas N, Hinckley A, Hook S, et al. Lyme disease surveillance in New York state: an assessment of case underreporting. Zoonoses Public Health. 2018;65:238–46. DOIPubMedGoogle Scholar
- Lohr B, Müller I, Mai M, Norris DE, Schöffski O, Hunfeld KP. Epidemiology and cost of hospital care for Lyme borreliosis in Germany: lessons from a health care utilization database analysis. Ticks Tick Borne Dis. 2015;6:56–62. DOIPubMedGoogle Scholar
- Joss AW, Davidson MM, Ho-Yen DO, Ludbrook A. Lyme disease—what is the cost for Scotland? Public Health. 2003;117:264–73. DOIPubMedGoogle Scholar
- van den Wijngaard CC, Hofhuis A, Wong A, Harms MG, de Wit GA, Lugnér AK, et al. The cost of Lyme borreliosis. Eur J Public Health. 2017;27:538–47. DOIPubMedGoogle Scholar
- Mead P, Hinckley A, Hook S, Beard CB. TickNET—a collaborative public health approach to tickborne disease surveillance and research. Emerg Infect Dis. 2015;21:1574–7. DOIPubMedGoogle Scholar
- Jo C. Cost-of-illness studies: concepts, scopes, and methods. Clin Mol Hepatol. 2014;20:327–37. DOIPubMedGoogle Scholar
- Tarricone R. Cost-of-illness analysis. What room in health economics? Health Policy. 2006;77:51–63. DOIPubMedGoogle Scholar
- Rice DP. Cost of illness studies: what is good about them? Inj Prev. 2000;6:177–9. DOIPubMedGoogle Scholar
- Rice DP. Estimating the cost of illness. Am J Public Health Nations Health. 1967;57:424–40. DOIPubMedGoogle Scholar
- Meltzer MI. Introduction to health economics for physicians. Lancet. 2001;358:993–8. DOIPubMedGoogle Scholar
- Centers for Disease Control and Prevention. Lyme disease (Borrelia burgdorferi) 2008 case definition. 2008 [cited 2019 Oct 18]. https://wwwn.cdc.gov/nndss/conditions/lyme-disease/case-definition/2008
- Centers for Medicare and Medicaid. PFS national payment amount file. 2019 [cited 2019 Nov 6]. https://www.cms.gov/Medicare/Medicare-Fee-for-Service-Payment/PhysicianFeeSched/PFS-National-Payment-Amount-File.html
- US Bureau of Labor Statistics. Historical consumer price index for all urban consumers (CPI-U) [cited 2019 Jun 27]. https://www.bls.gov/cpi/tables/supplemental-files/historical-cpi-u-201812.pdf
- Posey KG. Household Income: 2015. 2016 [cited 2022 Feb 1]. https://www.census.gov/content/dam/Census/library/publications/2016/acs/acsbr15-02.pdf
- Mihaylova B, Briggs A, O’Hagan A, Thompson SG. Review of statistical methods for analysing healthcare resources and costs. Health Econ. 2011;20:897–916. DOIPubMedGoogle Scholar
- Wickham H. tidyverse: easily install and load the ‘Tidyverse.’ R package version 1.2.1 ed; 2017 [cited 2022 May 3]. https://cran.r-project.org/web/packages/tidyverse/index.html
- Freedman GE. srvyr: ‘dplyr’-like syntax for summary statistics of survey data. R package version 0.3.4 ed; 2019 [cited 2022 May 3]. https://cran.r-project.org/web/packages/srvyr/index.html
- Lumley T. Survey: analysis of complex survey samples R package version 3.35–1 ed; 2019 [cited 2022 May 3]. https://cran.r-project.org/web/packages/survey/index.html
- Long J. jtools: Analysis and presentation of social scientific data. R package version 2.0.1 ed; 2019 [cited 2022 May 3]. https://cran.r-project.org/web/packages/jtools/index.html
- Wei T, Simko V. R package “corrplot”: visualization of a correlation matrix (version 0.84). Version 0.84 ed; 2017 [cited 2022 May 3]. https://www.rdocumentation.org/packages/corrplot/versions/0.84
- Fox J, Weisberg S. An {R} companion to applied regression, 2nd edition. Thousand Oaks (CA): Sage Publishing; 2011.
- Naleway AL, Belongia EA, Kazmierczak JJ, Greenlee RT, Davis JP. Lyme disease incidence in Wisconsin: a comparison of state-reported rates and rates from a population-based cohort. Am J Epidemiol. 2002;155:1120–7. DOIPubMedGoogle Scholar
- Cartter ML, Lynfield R, Feldman KA, Hook SA, Hinckley AF. Lyme disease surveillance in the United States: Looking for ways to cut the Gordian knot. Zoonoses Public Health. 2018;65:227–9. DOIPubMedGoogle Scholar
Figures
Tables
Cite This ArticleOriginal Publication Date: May 11, 2022
Table of Contents – Volume 28, Number 6—June 2022
| EID Search Options |
|---|
|
|
|
|
|
|
Please use the form below to submit correspondence to the authors or contact them at the following address:
Sarah Hook, Centers for Disease Control and Prevention, 3156 Rampart Rd, Mailstop P02, Fort Collins, CO, 80521, USA
Top