Volume 28, Number 6—June 2022
Dispatch
Dynamics of SARS-CoV-2 Antibody Response to CoronaVac followed by Booster Dose of BNT162b2 Vaccine
Figure 2
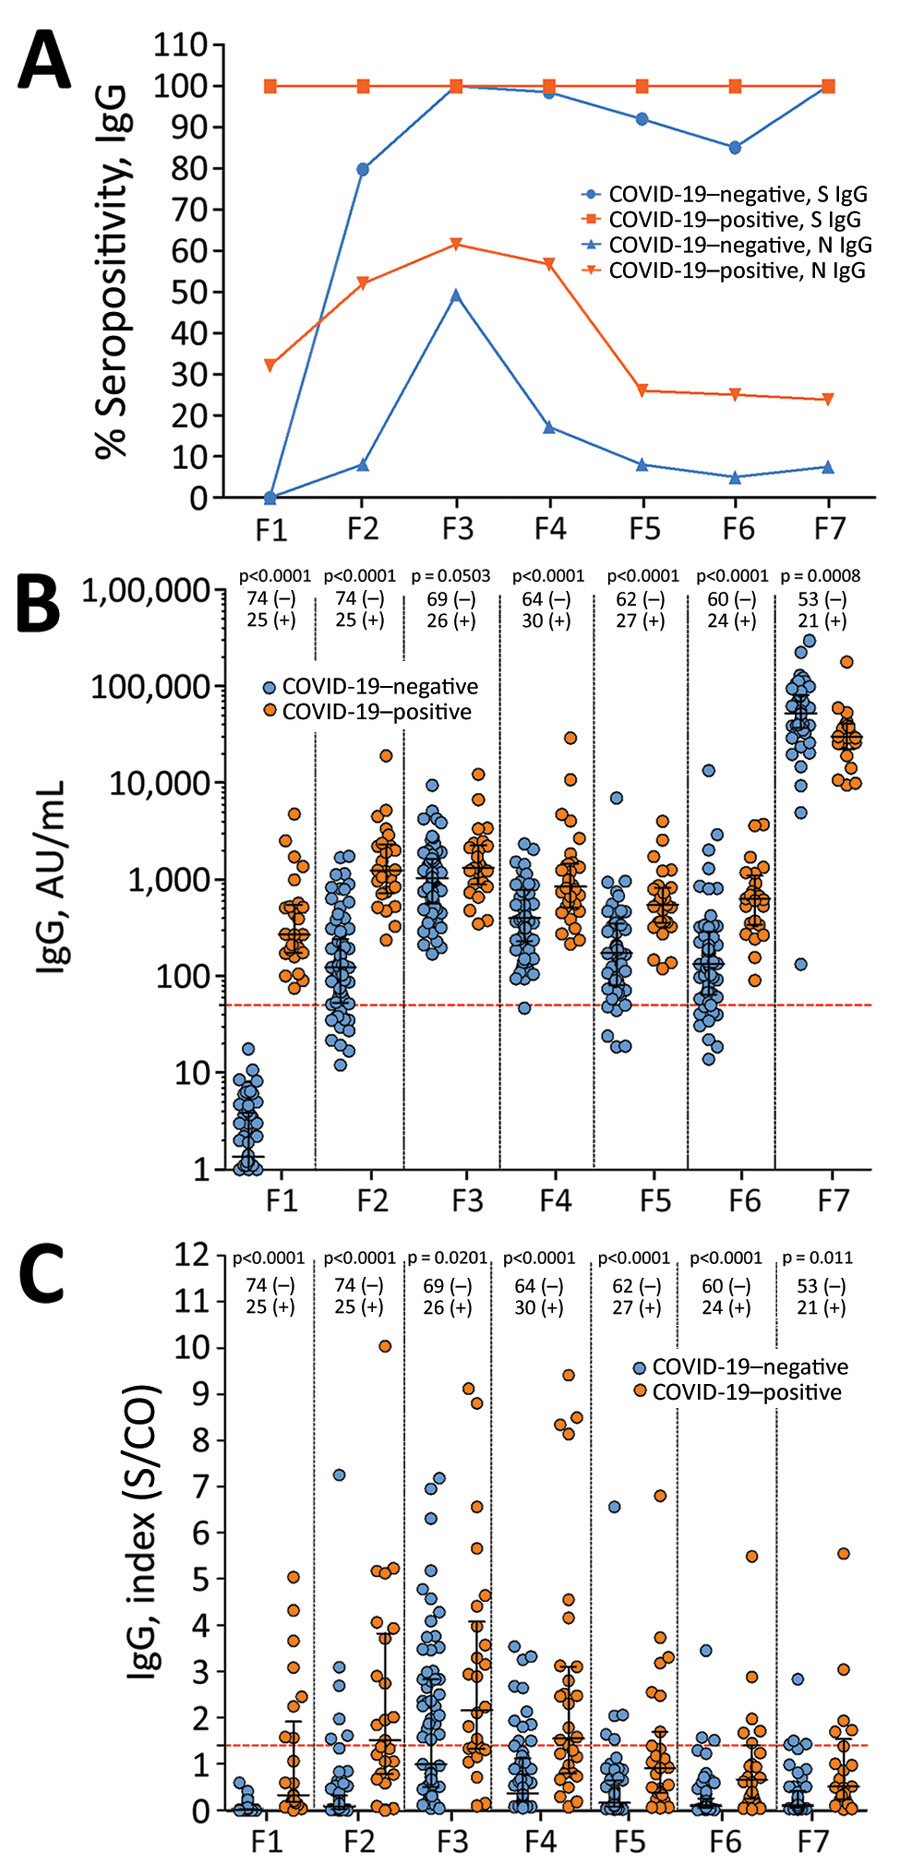
Figure 2. Comparison of antibody response over time among healthcare workers vaccinated with 2 doses of CoronaVac vaccine (https://www.sinovac.com) followed by a BNT162b2 vaccine (Pfizer-BioNTech, https://www.pfizer.com) booster dose, by COVID-19 positivity status. A) S and N IgG seropositivity. B) S IgG levels. C) N IgG levels. Antibody responses were evaluated before vaccination (timepoint P1); 28 days after the first dose of CoronaVac vaccine (P2); 30 (P3) 90 (P4), 180 (P5), and 230 (P6) days after the second dose of CoronaVac vaccine; and 15 days after the booster dose with BNT162b2 vaccine (P7). For panels B and C, black lines indicate median levels values and error bars interquartile ranges; the horizontal dotted line indicates the cutoff value of the assays. Numbers below p values indicate numbers of COVID-19–positive and COVID-19–negative persons in each timepoint. Statistical analysis performed using the Kruskal–Wallis test with subsequent Dunn’s multiple testing correction. N, nucleocapsid protein; S, spike protein; S/CO, signal-to-cutoff ratio; (–), COVID-19 negative; (+), COVID-19 positive.