Volume 28, Number 8—August 2022
Research
Association of Environmental Factors with Seasonal Intensity of Erysipelothrix rhusiopathiae Seropositivity among Arctic Caribou
O. Alejandro Aleuy , Michele Anholt, Karin Orsel, Fabien Mavrot, Catherine A. Gagnon, Kimberlee Beckmen, Steeve D. Côté, Christine Cuyler, Andrew Dobson, Brett Elkin, Lisa-Marie Leclerc, Joëlle Taillon, and Susan Kutz
Figure 3
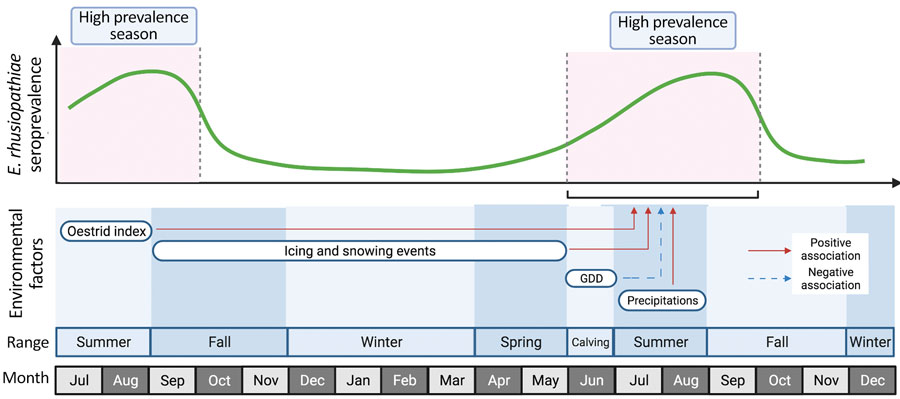
Figure 3. Schematic to explain the influence of environmental factors on the intensity of the seasonal prevalence of Erysipelothrix rhusiopathiae in caribou from Western North America during 1980–2019. Rows in the lower part of the figure indicate the temporal (month) and spatial (range) occurrence of each environmental factor. GDD, effective growing degree days (used to estimate growth and development of plants and insects).
Page created: June 02, 2022
Page updated: July 20, 2022
Page reviewed: July 20, 2022
The conclusions, findings, and opinions expressed by authors contributing to this journal do not necessarily reflect the official position of the U.S. Department of Health and Human Services, the Public Health Service, the Centers for Disease Control and Prevention, or the authors' affiliated institutions. Use of trade names is for identification only and does not imply endorsement by any of the groups named above.