Volume 29, Number 11—November 2023
Dispatch
Racial and Socioeconomic Equity of Tecovirimat Treatment during the 2022 Mpox Emergency, New York, New York, USA
Maura K. Lash1 , Ned H. Latham1, Pui Ying Chan, Mary M.K. Foote, Elizabeth A. Garcia, Matthew F. Silverstein, Marcia Wong, Mark Alexander, Karen A. Alroy, Lovedeep Bajaj, Kuan Chen, James Steele Howard, Lucretia E. Jones, Ellen H. Lee, Julian L. Watkins, and Tristan D. McPherson
Figure
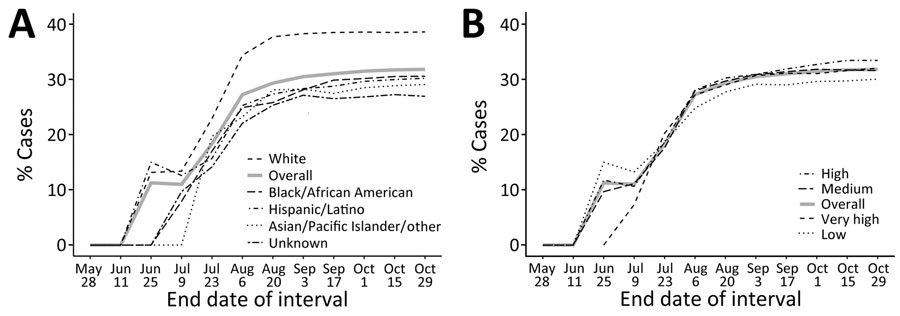
Figure. Comparisons of cumulative percentages of persons with mpox treated with tecovirimat during 2-week intervals in study of racial and socioeconomic equity of tecovirimat treatment during 2022 mpox emergency, New York City, New York, USA. Percentages of mpox cases diagnosed during May 19–October 29, 2022, are indicated. Treated persons who had no prescription date (n = 22) were not counted. A) Percentages according to race/ethnicity. B) Percentages according to neighborhood poverty level, defined as: low poverty, <10% of neighborhood population; medium, 10%–19.9%; high, 20%–29.9%; and very high, >30%.
1These first authors contributed equally to this article.
Page created: September 26, 2023
Page updated: October 23, 2023
Page reviewed: October 23, 2023
The conclusions, findings, and opinions expressed by authors contributing to this journal do not necessarily reflect the official position of the U.S. Department of Health and Human Services, the Public Health Service, the Centers for Disease Control and Prevention, or the authors' affiliated institutions. Use of trade names is for identification only and does not imply endorsement by any of the groups named above.