Skip directly to site content Skip directly to page options Skip directly to A-Z link Skip directly to A-Z link Skip directly to A-Z link
Volume 29, Number 11—November 2023
Research

Duration of Enterovirus D68 RNA Shedding in the Upper Respiratory Tract and Transmission among Household Contacts, Colorado, USA

Hai Nguyen-TranComments to Author , Careese Thompson, Molly Butler, Kristen R. Miller, Laura Pyle, Sarah Jung, Shannon Rogers, Terry Fei Fan Ng, Janell Routh, Samuel R. Dominguez, and Kevin Messacar
Author affiliations: University of Colorado, Aurora, Colorado, USA (H. Nguyen-Tran, K.R. Miller, L. Pyle, S.R. Dominguez, K. Messacar); Children’s Hospital Colorado, Aurora (C. Thompson, M. Butler, S. Jung); Centers for Disease Control and Prevention, Atlanta, Georgia, USA (S. Rogers, T.F.F. Ng, J. Routh)

Main Article

Figure 2

EV-D68 RNA shedding curve (A) and associated symptoms (B) for all EV-D68–positive participants (n = 14), Colorado, USA. A) Dotted line on Kaplan-Meier curve represents 95% CI. The + mark indicates the time at which 1 participant was censored at the last day of inpatient collection because they did not report dates of home testing. B) Number of participants reporting the symptom at any time is indicated. Black dots represent the median onset and median offset time for each symptom; solid horizontal line represents the duration between median onset and median offset time. The double vertical hash lines represent the 25th and 75th quartile for onset time, and the single vertical hash lines represent the 25th and 75th quartile for offset time. Symptoms on standardized list were abdominal pain, back pain, cough, diarrhea, difficulty breathing, difficulty swallowing, difficulty walking, facial droop/weakness, fever, headache, muscle jerks/tremors, nausea/vomiting, neck pain, pain in arms/legs, runny nose/nasal congestion, sore throat, vision changes, weakness in arms/legs, and wheezing. EV, enterovirus.

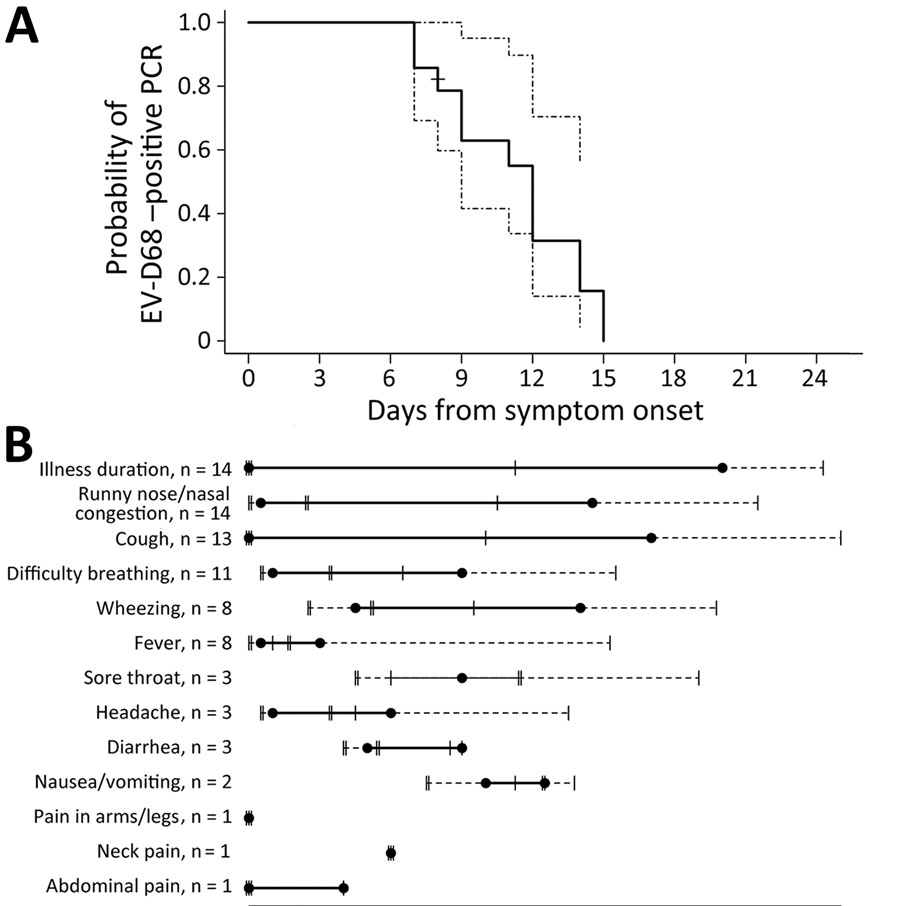
Figure 2. EV-D68 RNA shedding curve (A) and associated symptoms (B) for all EV-D68–positive participants (n = 14), Colorado, USA. A) Dotted line on Kaplan-Meier curve represents 95% CI. The + mark indicates the time at which 1 participant was censored at the last day of inpatient collection because they did not report dates of home testing. B) Number of participants reporting the symptom at any time is indicated. Black dots represent the median onset and median offset time for each symptom; solid horizontal line represents the duration between median onset and median offset time. The double vertical hash lines represent the 25th and 75th quartile for onset time, and the single vertical hash lines represent the 25th and 75th quartile for offset time. Symptoms on standardized list were abdominal pain, back pain, cough, diarrhea, difficulty breathing, difficulty swallowing, difficulty walking, facial droop/weakness, fever, headache, muscle jerks/tremors, nausea/vomiting, neck pain, pain in arms/legs, runny nose/nasal congestion, sore throat, vision changes, weakness in arms/legs, and wheezing. EV, enterovirus.

Main Article

Page created: October 02, 2023
Page updated: October 23, 2023
Page reviewed: October 23, 2023
The conclusions, findings, and opinions expressed by authors contributing to this journal do not necessarily reflect the official position of the U.S. Department of Health and Human Services, the Public Health Service, the Centers for Disease Control and Prevention, or the authors' affiliated institutions. Use of trade names is for identification only and does not imply endorsement by any of the groups named above.
file_external