Volume 29, Number 3—March 2023
Research Letter
Emergence of Mycobacterium orygis–Associated Tuberculosis in Wild Ruminants, India
Megha Sharma, Karikalan Mathesh , Premanshu Dandapat , Asok Kumar Mariappan, Ravi Kumar, Soni Kumari, Vivek Kapur, Sushila Maan, Naresh Jindal, Nitish Bansal, Riyaz Kadiwar, Abhishek Kumar, Nitin Gupta, A.M. Pawde, and A.K. Sharma
Figure
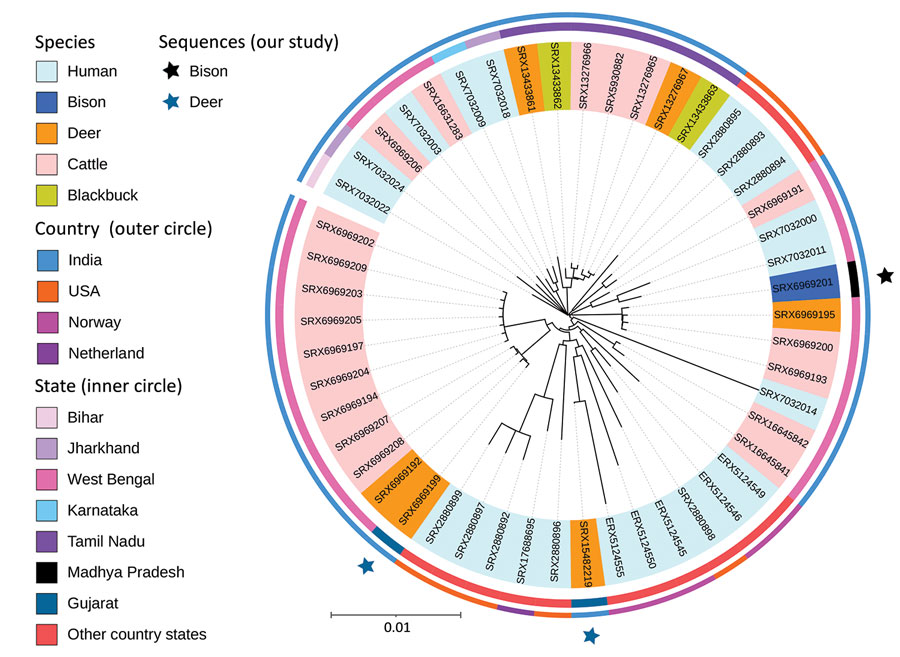
Figure. Phylogeny of newly sequenced Mycobacterium orygis wildlife isolates from 3 wild animals in India (black star, bison; blue stars, deer) and reference sequences. The outer circle shows the distribution of isolates in India, Norway, the Netherlands, and the United States. The inner circle shows the statewise distribution within countries. Shading of branch labels corresponds to different species. Scale bar of 0.01 indicates 1 change for every 100 nucleotides.
Page created: January 12, 2023
Page updated: February 20, 2023
Page reviewed: February 20, 2023
The conclusions, findings, and opinions expressed by authors contributing to this journal do not necessarily reflect the official position of the U.S. Department of Health and Human Services, the Public Health Service, the Centers for Disease Control and Prevention, or the authors' affiliated institutions. Use of trade names is for identification only and does not imply endorsement by any of the groups named above.