Volume 29, Number 8—August 2023
Research
Waterborne Infectious Diseases Associated with Exposure to Tropical Cyclonic Storms, United States, 1996–2018
Figure 5
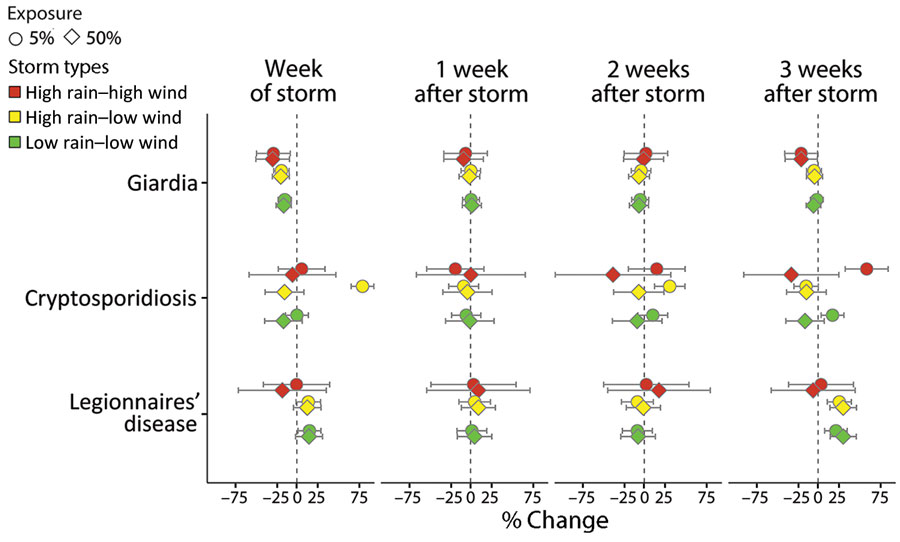
Figure 5. Average percent change in weekly waterborne infectious disease case rates associated with exposure to tropical cyclonic storm types, United States, 1996–2018. Exposure is defined by 3 categories according to rainfall and wind thresholds: high rain–high wind (red); high rain–low wind (yellow); and low rain–low wind (green). Estimates (shapes) and Bonferroni-corrected 95% CIs (bars) are reported for giardiasis, cryptosporidiosis, and Legionnaires’ disease at 2 population-exposure thresholds (shape) for the week of the storm (week 0) and 1–3 weeks after the storm. The population-exposure thresholds refer to the percentage of the state population exposed to storm-related rainfall only; no hurricane-force winds affected >25% of the state population.