Volume 29, Number 9—September 2023
Synopsis
Participatory Mathematical Modeling Approach for Policymaking during the First Year of the COVID-19 Crisis, Jordan
Saverio Bellizzi1 , Nicholas Letchford1, Keyrellous Adib1, William J.M. Probert, Penelope Hancock, Lora Alsawalha, Alessio Santoro, Maria C. Profili, Ricardo Aguas, Christian Popescu, Lubna Al Ariqi, Lisa White, Wail Hayajneh, Nathir Obeidat, and Pierre Nabeth
Figure 5
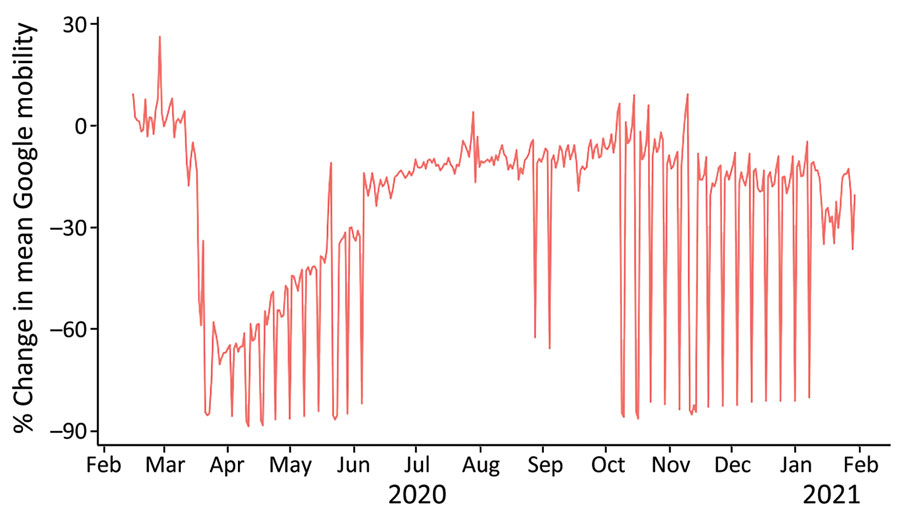
Figure 5. Percentage changes in mean mobility among the population, Jordan, February 2020–January 2021, including around retail and recreational facilities, grocery and pharmacy stores, parks, and transit locations. Google mobility data are used as a proxy for the population’s coverage and adherence to COVID-19–related physical distancing interventions.
1These first authors contributed equally to this article.
Page created: July 06, 2023
Page updated: August 20, 2023
Page reviewed: August 20, 2023
The conclusions, findings, and opinions expressed by authors contributing to this journal do not necessarily reflect the official position of the U.S. Department of Health and Human Services, the Public Health Service, the Centers for Disease Control and Prevention, or the authors' affiliated institutions. Use of trade names is for identification only and does not imply endorsement by any of the groups named above.