Volume 29, Number 9—September 2023
Research
Shifting Patterns of Influenza Circulation during the COVID-19 Pandemic, Senegal
Alexandre Lampros , Cheikh Talla, Maryam Diarra, Billo Tall, Samba Sagne, Mamadou Korka Diallo, Boly Diop, Ibrahim Oumar, Ndongo Dia, Amadou Alpha Sall, Mamadou Aliou Barry1 , and Cheikh Loucoubar1
Figure 2
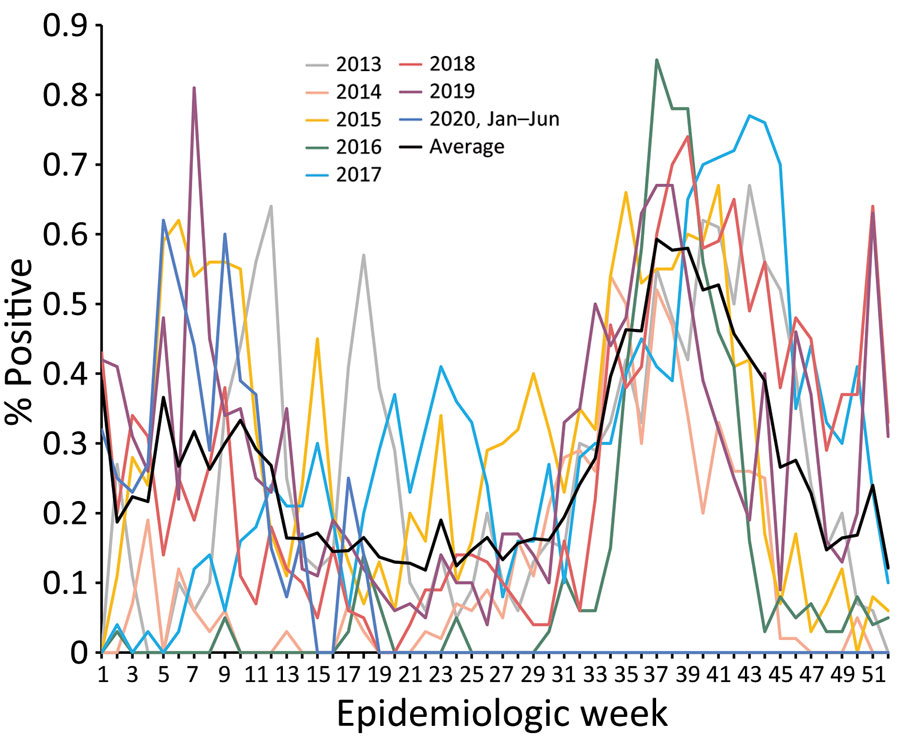
Figure 2. Prepandemic average epidemic curves used to demonstrate shifting patterns of influenza circulation during the COVID-19 pandemic, Senegal. Graphs show annual and overall average percentage of influenza-positive reverse transcription PCR tests per epidemiology week reported by the sentinelle syndromique du Sénégal (sentinel syndromic surveillance of Senegal), also known as the 4S Network, during January 2013–January 2020.
1These authors contributed equally to this article.
Page created: July 21, 2023
Page updated: August 20, 2023
Page reviewed: August 20, 2023
The conclusions, findings, and opinions expressed by authors contributing to this journal do not necessarily reflect the official position of the U.S. Department of Health and Human Services, the Public Health Service, the Centers for Disease Control and Prevention, or the authors' affiliated institutions. Use of trade names is for identification only and does not imply endorsement by any of the groups named above.