Skip directly to site content Skip directly to page options Skip directly to A-Z link Skip directly to A-Z link Skip directly to A-Z link
Volume 29, Number 9—September 2023
Dispatch

Infection-Induced SARS-CoV-2 Seroprevalence among Blood Donors, Japan, 2022

Ryo Kinoshita, Takeshi Arashiro, Noriko Kitamura, Satoru Arai, Koki Takahashi, Tadaki Suzuki, Motoi Suzuki1Comments to Author , and Daisuke Yoneoka1Comments to Author 
Author affiliations: National Institute of Infectious Diseases, Tokyo, Japan (R. Kinoshita, T. Arashiro, N. Kitamura, S. Arai, T. Suzuki, M. Suzuki, D. Yoneoka); Japanese Red Cross Society, Tokyo, Japan (K. Takahashi)

Main Article

Figure 2

Analyses of weighted seroprevalence of SARS-CoV-2 among blood donors from November 6–13, 2022, compared with reported cases among the general population, Japan. A) Weighted seroprevalence by prefecture. B) Relationship between population density (persons/km2) and weighted seroprevalence by prefecture. Circle sizes indicate percentage of infected persons based on cumulative number of reported cases; colors indicate vaccination coverage for >3 doses of COVID-19 vaccine. C) Ratio of weighted seroprevalence to the percentage of cumulative number of reported cases (estimated to reported infections) by prefecture. D) Relationship between weighted seroprevalence and percentage of cumulative number of reported cases by prefecture. Circle sizes represent absolute value of cumulative number of reported cases.

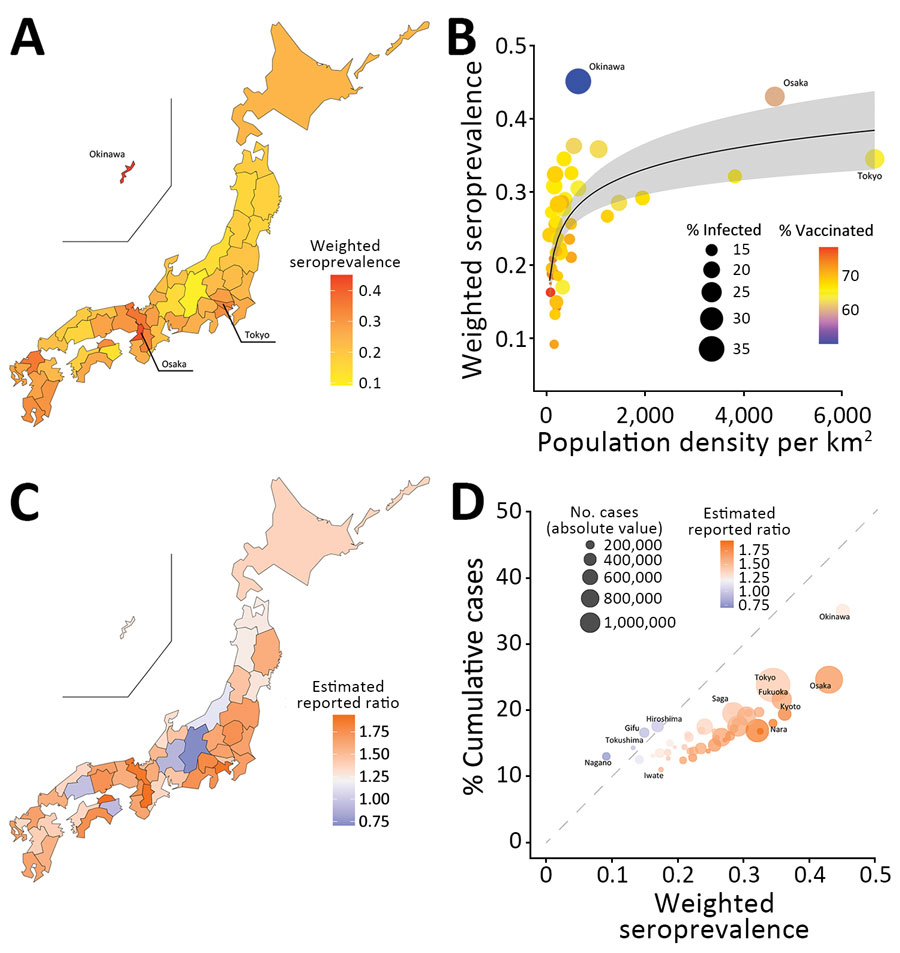
Figure 2. Analyses of weighted seroprevalence of SARS-CoV-2 among blood donors from November 6–13, 2022, compared with reported cases among the general population, Japan. A) Weighted seroprevalence by prefecture. B) Relationship between population density (persons/km2) and weighted seroprevalence by prefecture. Circle sizes indicate percentage of infected persons based on cumulative number of reported cases; colors indicate vaccination coverage for >3 doses of COVID-19 vaccine. C) Ratio of weighted seroprevalence to the percentage of cumulative number of reported cases (estimated to reported infections) by prefecture. D) Relationship between weighted seroprevalence and percentage of cumulative number of reported cases by prefecture. Circle sizes represent absolute value of cumulative number of reported cases.

Main Article

1These senior authors contributed equally to this article.

Page created: July 17, 2023
Page updated: August 20, 2023
Page reviewed: August 20, 2023
The conclusions, findings, and opinions expressed by authors contributing to this journal do not necessarily reflect the official position of the U.S. Department of Health and Human Services, the Public Health Service, the Centers for Disease Control and Prevention, or the authors' affiliated institutions. Use of trade names is for identification only and does not imply endorsement by any of the groups named above.
file_external