Volume 29, Number 9—September 2023
CME ACTIVITY - Synopsis
Foodborne Botulism, Canada, 2006–20211
Figure 2
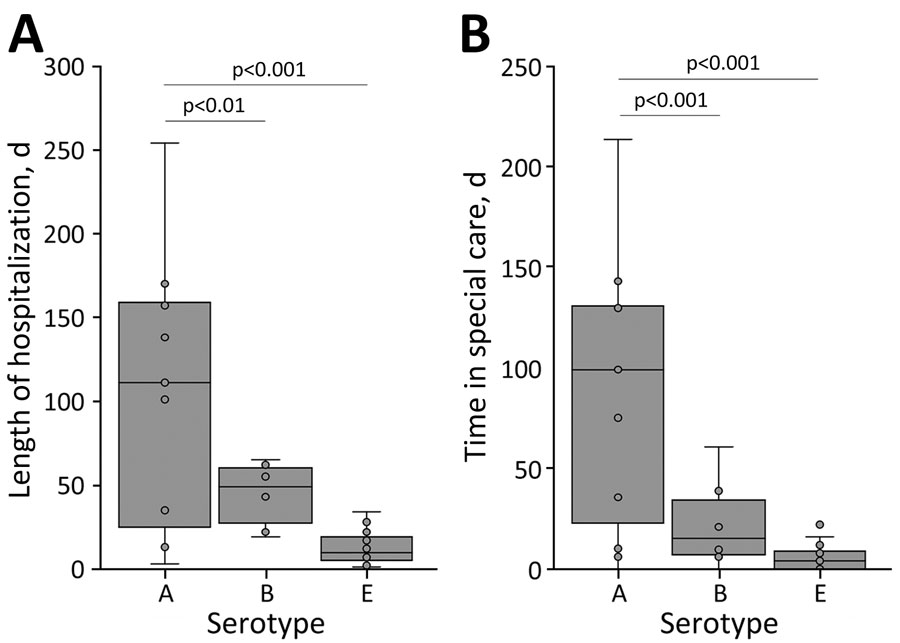
Figure 2. Box and whisker plots of length of hospitalization and special care among persons affected by foodborne botulism serotypes A, B, and E, Canada, 2006–2021. A) Length of hospitalization; B) length of time in a special care unit. The box and whiskers represent the data as quartiles; the whiskers (vertical lines) represent the top and bottom values, the box represents the 1st (bottom) to 3rd (top) quartiles of values, and the horizontal line in the middle of the box represents the median. The circles indicate individual data points including outliers. A single outlier for time in special care occurred for serotype E.
1Results of this study were originally presented at the 58th Annual Interagency Botulism Research Coordinating Committee (IBRCC) Meeting, Richmond, California, USA, October 17–18, 2022.