Skip directly to site content Skip directly to page options Skip directly to A-Z link Skip directly to A-Z link Skip directly to A-Z link
Volume 30, Number 10—October 2024
Dispatch

Dengue Virus Serotype 3 Origins and Genetic Dynamics, Jamaica

Shanice A. Redman1, Lester J. Perez1, Kenn Forberg, Keisha Francis, Jerome P. Walker, Tamara K. Thompson, Heather Phillips, Gavin A. Cloherty, Michael G. Berg, and Joshua J. AnzingerComments to Author 
Author affiliations: Abbott Pandemic Defense Coalition, Kingston, Jamaica (S.A. Redman, K. Francis, J.P. Walker, T.K. Thompson, H. Phillips, J.J. Anzinger); The University of the West Indies, Kingston (S.A. Redman, K. Francis, J.P. Walker, T.K. Thompson, H. Phillips, J.J. Anzinger); Abbott Laboratories, Abbott Park, Illinois, USA (L.J. Perez, K. Forberg, G.A. Cloherty, M.G. Berg); Abbott Pandemic Defense Coalition, Abbott Park (L.J. Perez, K. Forberg, G.A. Cloherty, M.G. Berg); Global Virus Network, Baltimore, Maryland, USA (J.J. Anzinger)

Main Article

Figure 3

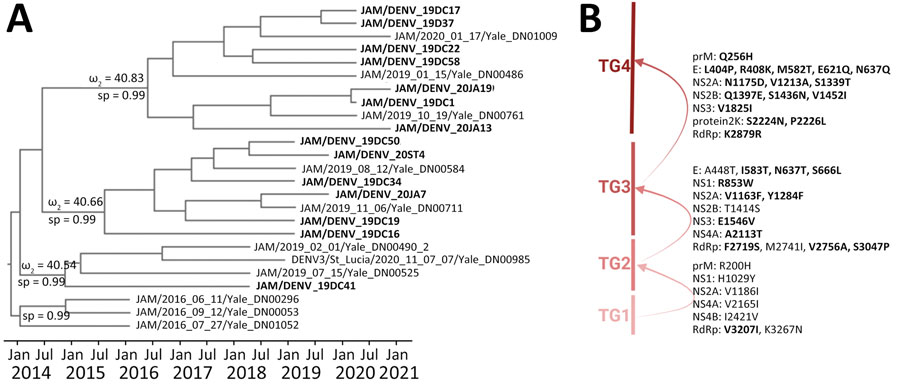
Time-scaled phylogenetic analysis, molecular characterization, dynamics, and natural selection of dengue virus serotype 3 in Jamaica. A) Phylogenetic tree indicates monophyletic clusters of strains from Jamaica (bold text) extracted from the discrete phylogeographic analysis (Figure 2). Discrete sp values (ω) for nodes evaluated for episodic selection are shown. Full sp values for nodes are shown in Appendix Figure 2, panel B. B) Strains were evaluated for amino acid replacements according to each TG. Arrows indicate episodic selection of each main TG clade. Bold text indicates positively selected mutations. sp, state probability; TG, temporal group.

Figure 3. Time-scaled phylogenetic analysis, molecular characterization, dynamics, and natural selection of dengue virus serotype 3 in Jamaica. A) Phylogenetic tree indicates monophyletic clusters of strains from Jamaica (bold text) extracted from the discrete phylogeographic analysis (Figure 2). Discrete sp values (ω) for nodes evaluated for episodic selection are shown. Full sp values for nodes are shown in Appendix Figure 2, panel B. B) Strains were evaluated for amino acid replacements according to each TG. Arrows indicate episodic selection of each main TG clade. Bold text indicates positively selected mutations. sp, state probability; TG, temporal group.

Main Article

1These first authors contributed equally to this article.

Page created: August 01, 2024
Page updated: September 23, 2024
Page reviewed: September 23, 2024
The conclusions, findings, and opinions expressed by authors contributing to this journal do not necessarily reflect the official position of the U.S. Department of Health and Human Services, the Public Health Service, the Centers for Disease Control and Prevention, or the authors' affiliated institutions. Use of trade names is for identification only and does not imply endorsement by any of the groups named above.
file_external