Skip directly to site content Skip directly to page options Skip directly to A-Z link Skip directly to A-Z link Skip directly to A-Z link
Volume 30, Number 10—October 2024
Dispatch

Clustering of Polymorphic Membrane Protein E Clade in Chlamydia trachomatis Lineages from Men Who Have Sex with Men

Morika Mitobe, Hiroaki KubotaComments to Author , Kai Kobayashi, Hirofumi Miyake, Misao Takano, Daisuke Mizushima, Hiroyuki Gatanaga, Shinichi Oka, Jun Suzuki, and Kenji Sadamasu
Author affiliation: Author affiliations: Tokyo Metropolitan Institute of Public Health, Tokyo, Japan (M. Mitobe, H. Kubota, K. Kobayashi, H. Miyake, J. Suzuki, K. Sadamasu); National Center for Global Health and Medicine, Tokyo (M. Takano, D. Mizushima, H. Gatanaga, S. Oka)

Main Article

Figure 2

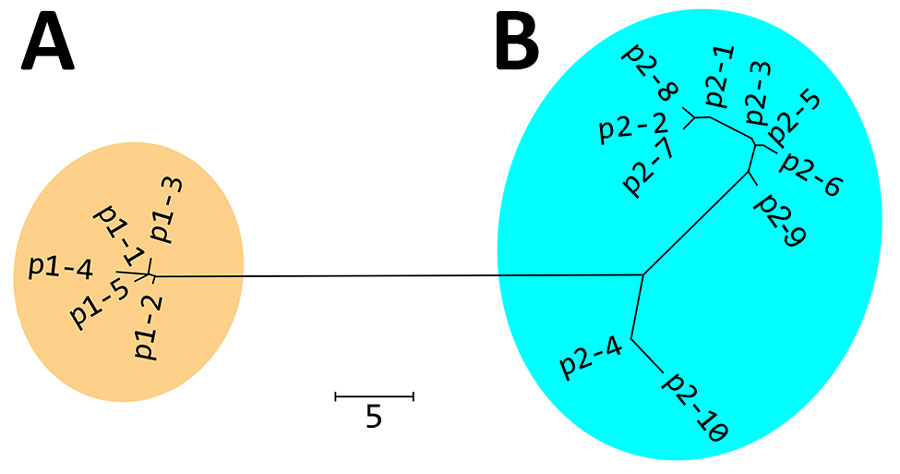
Nonrooted phylogenetic tree created on the basis of polymorphic membrane protein E of 298 Chlamydia trachomatis samples in study of clustering of specific polymorphic membrane protein E clade in C. trachomatis lineages from MSM, Japan. A) Cluster of 96.7% MSM (237 samples) and 0% non-MSM (0 samples); B) cluster of 3.3% MSM (8 samples) and 100% non-MSM (53 samples). p1 and p2 are 2 clades representing the MSM (p1) and non-MSM (p2) populations. The amino acid sequences of p1–1 to p2–10 are shown in Appendix 2 Figure. Numbers of samples included in each sequence: p1-1, n = 178; p1-2, n = 56; p1-3, n = 1; p1-4, n = 1; p1-5, n = 1; p2-1, n = 16; p2-2, n = 14; p2-3, n = 10; p2-4, n = 9; p2-5, n = 6; p2-6, n = 2; p2-7, n = 1; p2-8, n = 1; p2-9, n = 1; and p2-10, n = 1. Scale bar indicates the number of amino acid differences.

Figure 2. Nonrooted phylogenetic tree created on the basis of polymorphic membrane protein E of 298 Chlamydia trachomatis samples in study of clustering of specific polymorphic membrane protein E clade in C. trachomatis lineages from MSM, Japan. A) Cluster of 96.7% MSM (237 samples) and 0% non-MSM (0 samples); B) cluster of 3.3% MSM (8 samples) and 100% non-MSM (53 samples). p1 and p2 are 2 clades representing the MSM (p1) and non-MSM (p2) populations. The amino acid sequences of p1–1 to p2–10 are shown in Appendix 2 Figure. Numbers of samples included in each sequence: p1-1, n = 178; p1-2, n = 56; p1-3, n = 1; p1-4, n = 1; p1-5, n = 1; p2-1, n = 16; p2-2, n = 14; p2-3, n = 10; p2-4, n = 9; p2-5, n = 6; p2-6, n = 2; p2-7, n = 1; p2-8, n = 1; p2-9, n = 1; and p2-10, n = 1. Scale bar indicates the number of amino acid differences.

Main Article

Page created: September 04, 2024
Page updated: September 23, 2024
Page reviewed: September 23, 2024
The conclusions, findings, and opinions expressed by authors contributing to this journal do not necessarily reflect the official position of the U.S. Department of Health and Human Services, the Public Health Service, the Centers for Disease Control and Prevention, or the authors' affiliated institutions. Use of trade names is for identification only and does not imply endorsement by any of the groups named above.
file_external