Volume 30, Number 11—November 2024
Research
Spatiotemporal Ecologic Analysis of COVID-19 Vaccination Coverage and Outcomes, Oklahoma, USA, February 2020–December 2021
Kai Ding , Ozair H. Naqvi, R. Jackson Seeberger, Dale W. Bratzler, and Aaron M. Wendelboe
Figure 4
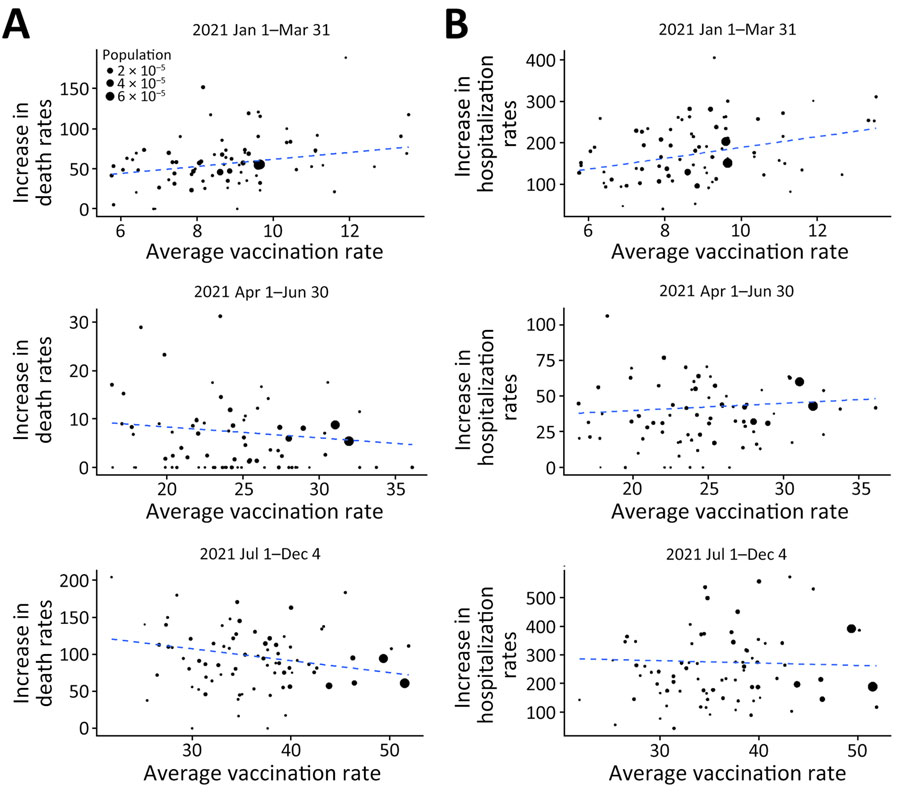
Figure 4. Scatter plot of county-level population percentage of complete vaccination series (averaged between the start and the end dates) versus increase in cumulative death rates (A) and cumulative hospitalization rates (B) per 100,000 residents for selected time intervals in analysis of COVID-19 vaccination coverage and outcomes, Oklahoma, USA, February 2020–December 2021. The dashed line is the weighted (by county population size) least-squares line. The 2 largest solid dots in the plot correspond to the 2 largest counties (i.e., Oklahoma and Tulsa) in Oklahoma.
Page created: August 28, 2024
Page updated: October 22, 2024
Page reviewed: October 22, 2024
The conclusions, findings, and opinions expressed by authors contributing to this journal do not necessarily reflect the official position of the U.S. Department of Health and Human Services, the Public Health Service, the Centers for Disease Control and Prevention, or the authors' affiliated institutions. Use of trade names is for identification only and does not imply endorsement by any of the groups named above.