Volume 30, Number 11—November 2024
Research
Estimating Influenza Illnesses Averted by Year-Round and Seasonal Campaign Vaccination for Young Children, Kenya
Radhika Gharpure, Young M. Yoo, Ben Andagalu, Stefano Tempia, Sergio Loayza, Chiedza Machingaidze, Bryan O. Nyawanda, Jeanette Dawa, Eric Osoro, Rose Jalang’o, Kathryn E. Lafond, Melissa A. Rolfes, and Gideon O. Emukule
Figure
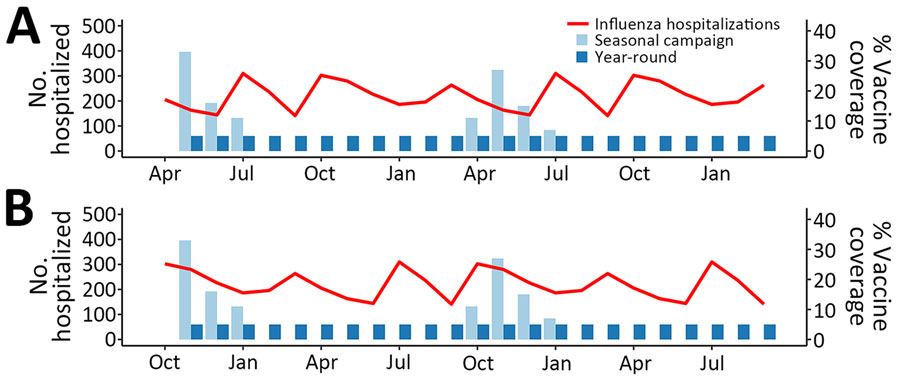
Figure. Modeled influenza hospitalizations and vaccine coverage among children 6–23 months of age in Kenya, by delivery strategy. Red line indicates no. monthly hospitalizations, corresponding to the left y-axis. Light blue bars represent percentage vaccine coverage for the seasonal-campaign strategy and dark blue bars the year-round strategy, corresponding to the right y-axis. Hospitalization curves are identical for both the introduction year (months 1–12) and postintroduction year (months 13–24). A) April introduction of vaccination. B) October introduction of vaccination.
Page created: October 07, 2024
Page updated: October 22, 2024
Page reviewed: October 22, 2024
The conclusions, findings, and opinions expressed by authors contributing to this journal do not necessarily reflect the official position of the U.S. Department of Health and Human Services, the Public Health Service, the Centers for Disease Control and Prevention, or the authors' affiliated institutions. Use of trade names is for identification only and does not imply endorsement by any of the groups named above.