Skip directly to site content Skip directly to page options Skip directly to A-Z link Skip directly to A-Z link Skip directly to A-Z link
Volume 30, Number 11—November 2024
Research

SARS-CoV-2 Infection in School Settings, Okinawa Prefecture, Japan, 2021–2022

Yoshihiro Takayama, Yusuke Shimakawa, Ryota Matsuyama, Gerardo Chowell, Ryosuke Omori, Tetsuharu Nagamoto, Taro Yamamoto, and Kenji MizumotoComments to Author 
Author affiliation: Okinawa Chubu Hospital, Uruma, Japan (Y. Takayama); Okinawa Prefecture Epidemiological Statistics and Analysis Committee, Naha-shi, Japan (Y. Takayama, Y. Shimakawa, R. Matusuyama, R. Omori, T. Nagamoto, K. Mizumoto); Institute of Tropical Medicine Department of International Health and Medical Anthropology, Nagasaki University, Nagasaki, Japan (Y. Takayama, T. Yamamoto); Institut Pasteur, Université Paris Cité, Paris, France (Y. Shimakawa); Pasteur International Unit at Kumamoto University/National Center for Global Health and Medicine, Tokyo, Japan (Y. Shimakawa); Rakuno Gakuen Univerisity, Ebetsu, Japan (R. Matsuyama); Georgia State University School of Public Health, Atlanta, Georgia, USA (G. Chowell); International Institute for Zoonosis Control, Hokkaido University, Sapporo, Japan (R. Omori); Kyoto University Graduate School of Advanced Integrated Studies in Human Survivability, Kyoto, Japan (K. Mizumoto)

Main Article

Figure 2

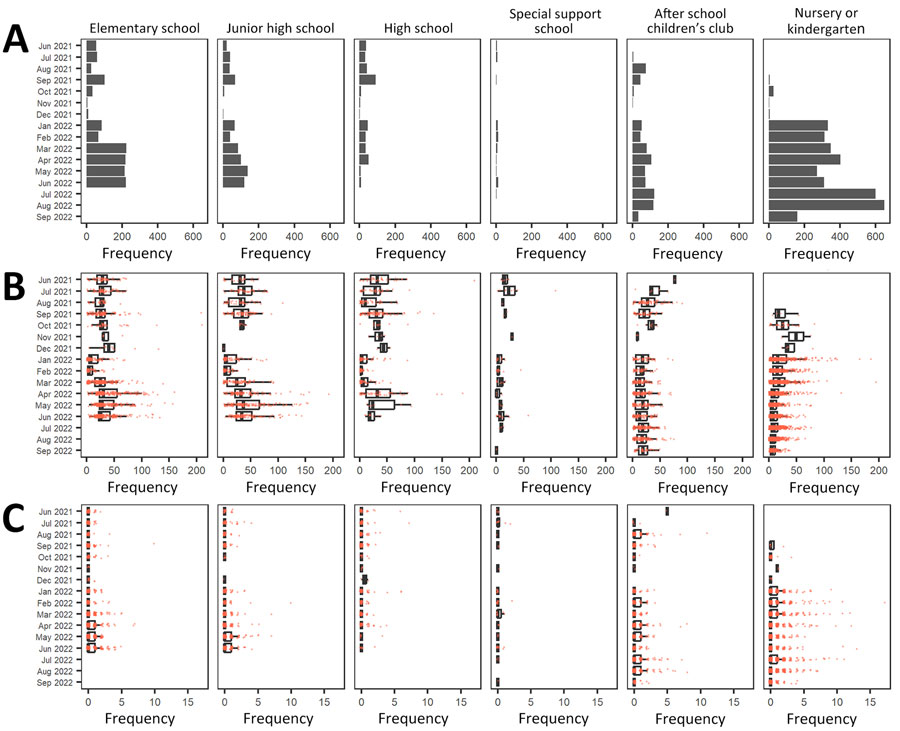
Results of SARS-CoV-2 PCR projects conducted in school settings, by month and school type, Okinawa Prefecture, Japan, 2021–2022. A) Number of events that results in school contact tracing, by month and school type. B) Number of PCR tests per event, by month stratified by school type. C) Number of secondary SARS-CoV-2 infection cases per event, by month and school type. Box-and-whisker plots indicate the median (solid black lines), the first and third quartiles (box left and right edges), and minimum and maximum values excluding outliers (error bars). Orange particles represent each observed datapoint.

Figure 2. Results of SARS-CoV-2 PCR projects conducted in school settings, by month and school type, Okinawa Prefecture, Japan, 2021–2022. A) Number of events that results in school contact tracing, by month and school type. B) Number of PCR tests per event, by month stratified by school type. C) Number of secondary SARS-CoV-2 infection cases per event, by month and school type. Box-and-whisker plots indicate the median (solid black lines), the first and third quartiles (box left and right edges), and minimum and maximum values excluding outliers (error bars). Orange particles represent each observed datapoint.

Main Article

Page created: October 02, 2024
Page updated: October 22, 2024
Page reviewed: October 22, 2024
The conclusions, findings, and opinions expressed by authors contributing to this journal do not necessarily reflect the official position of the U.S. Department of Health and Human Services, the Public Health Service, the Centers for Disease Control and Prevention, or the authors' affiliated institutions. Use of trade names is for identification only and does not imply endorsement by any of the groups named above.
file_external