Volume 30, Supplement—March 2024
SUPPLEMENT ISSUE
Surveillance
Correlation of SARS-CoV-2 in Wastewater and Individual Testing Results in a Jail, Atlanta, Georgia, USA
Lindsay B. Saber, Shanika S. Kennedy, Yixin Yang, Kyler N. Moore, Yuke Wang, Stephen P. Hilton, Tylis Y. Chang, Pengbo Liu, Victoria L. Phillips, Matthew J. Akiyama, Christine L. Moe, and Anne C. Spaulding
Figure 3
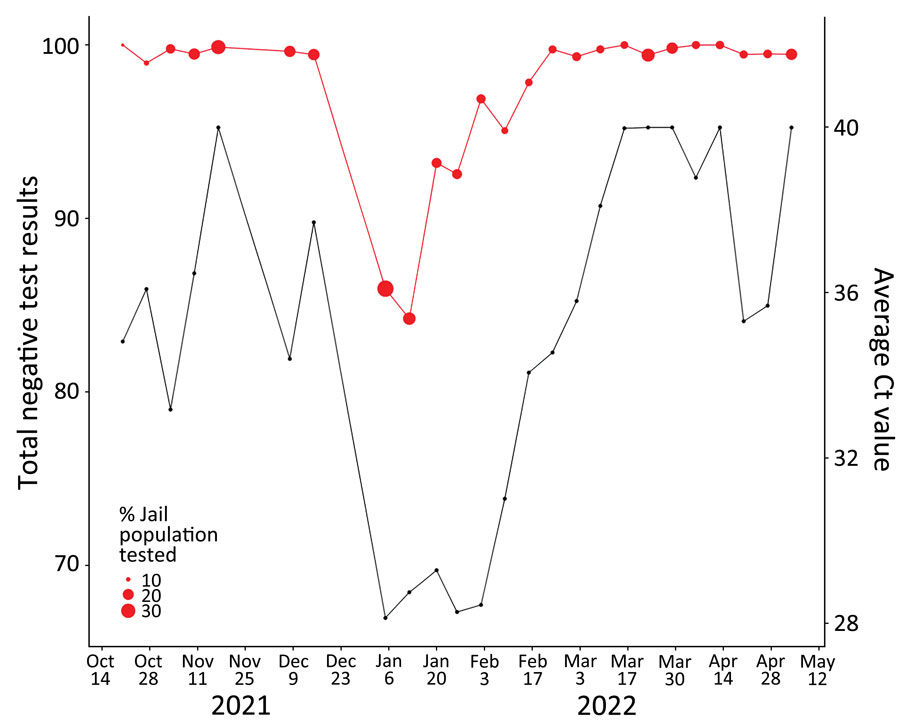
Figure 3. Average Ct values of wastewater samples (black lines) versus total percentage of negative COVID-19 diagnostic test results (red lines), Fulton County Jail, Atlanta, Georgia, USA, October 2021‒May 2022. Dot sizes are proportional to the percentage of the jail population undergoing a COVID-19 diagnostic test for the corresponding week. Ct, cycle threshold.
Page created: August 31, 2023
Page updated: April 01, 2024
Page reviewed: April 01, 2024
The conclusions, findings, and opinions expressed by authors contributing to this journal do not necessarily reflect the official position of the U.S. Department of Health and Human Services, the Public Health Service, the Centers for Disease Control and Prevention, or the authors' affiliated institutions. Use of trade names is for identification only and does not imply endorsement by any of the groups named above.