Introduction and Spread of Dengue Virus 3, Florida, USA, May 2022–April 2023
Forrest K. Jones
1
, Andrea M. Morrison
1, Gilberto A. Santiago, Kristyna Rysava, Rebecca A. Zimler, Lea A. Heberlein, Edgar Kopp, Katharine E. Saunders, Samantha Baudin, Edhelene Rico

, Álvaro Mejía-Echeverri, Emma Taylor-Salmon, Verity Hill, Mallery I. Breban, Chantal B.F. Vogels, Nathan D. Grubaugh, Lauren M. Paul, Scott F. Michael, Michael A. Johansson, Laura E. Adams, Jorge Munoz-Jordan, Gabriela Paz-Bailey, Danielle R. Stanek, and
Florida Department of Health Bureau of Public Health Laboratory Team,2
Author affiliations: Centers for Disease Control and Prevention, San Juan, Puerto Rico, USA (F.K. Jones, G.A. Santiago, M.A. Johansson, L.E. Adams, J. Munoz-Jordan, G. Paz-Bailey, K. Rysava); Centers for Disease Control and Prevention, Atlanta, Georgia, USA (F.K. Jones, K.E. Saunders); Florida Department of Health, Tallahassee, Florida, USA (A.M. Morrison, R.A. Zimler, L.A. Heberlein, E. Kopp, K.E. Saunders, S. Baudin, E. Rico, Á. Mejía-Echeverri, D.R. Stanek); Yale School of Medicine, New Haven, Connecticut, USA (E. Taylor-Salmon); Yale School of Public Health, New Haven (E. Taylor-Salmon, V. Hill, M.I. Breban, C.B.F. Vogels, N.D. Grubaugh); Florida Gulf Coast University, Fort Myers, Florida, USA (L.M. Paul, S.F. Michael)
Main Article
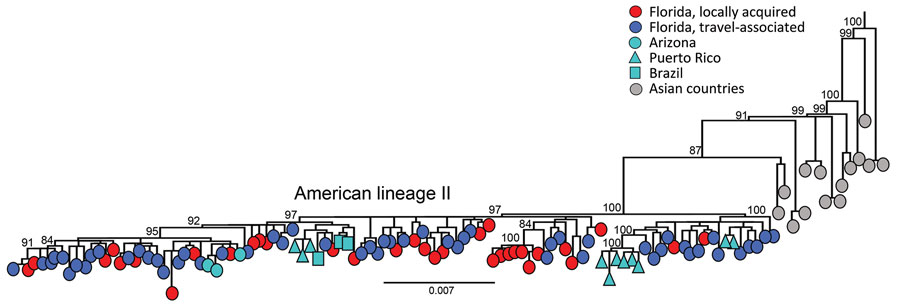
Figure 2

Figure 2. Evolutionary analysis of dengue virus serotype 3 sampled in Florida, USA, May 1, 2022–April 30, 2023. Maximum-likelihood phylogenetic tree was generated from a subset of 203 complete genomes from Florida (34 local cases, 168 cases in persons with recent travel history to Cuba, and 1 traveler case from Guyana) and 146 complete genomes publicly available (1985–2022) from GenBank representing genotype III, American lineage II. A subset of the sequences was used because of the low diversity in the population sample, which was limiting the phylogenetic signal and hampering the statistical analyses that supported the tree accuracy and certainty in major nodes. Sampling locations are coded by shape and color. Scale bar represents nucleotide substitutions per site.
Main Article
Page created: December 31, 2023
Page updated: January 24, 2024
Page reviewed: January 24, 2024
The conclusions, findings, and opinions expressed by authors contributing to this journal do not necessarily reflect the official position of the U.S. Department of Health and Human Services, the Public Health Service, the Centers for Disease Control and Prevention, or the authors' affiliated institutions. Use of trade names is for identification only and does not imply endorsement by any of the groups named above.
