Skip directly to site content Skip directly to page options Skip directly to A-Z link Skip directly to A-Z link Skip directly to A-Z link
Volume 30, Number 6—June 2024
Dispatch

Infection- and Vaccine-Induced SARS-CoV-2 Seroprevalence, Japan, 2023

Ryo Kinoshita1, Sho Miyamoto1, Shoko Sakuraba, Jun Sugihara, Motoi Suzuki, Tadaki Suzuki2Comments to Author , and Daisuke Yoneoka2Comments to Author 
Author affiliations: National Institute of Infectious Diseases, Tokyo, Japan (R. Kinoshita, S. Miyamoto, M. Suzuki, T. Suzuki, D. Yoneoka); Ministry of Health, Labour, and Welfare, Tokyo (S. Sakuraba, J. Sugihara)

Main Article

Figure 2

Age-stratified weighted concentrations of spike SARS-Cov-2 antibody stratified by nucleocapsid SARS-Cov-2 antibody seroprevalence in Japan, 2023. A) Spike antibody concentrations stratified by nucleocapsid antibody seroprevalence in persons 6 months to >95 years of age. Red dashed box represents the age group analyzed in panel B. B) Spike antibody concentrations stratified by nucleocapsid antibody seroprevalence in persons 6 months to 4 years of age. Horizonal lines within boxes indicate the median, box tops and bottoms indicate the 75th percentile and 25th percentile, and whiskers extend to 1.5 times the interquartile range (IQR) from 25th percentile and 75th percentile. Dotted horizontal lines represent the cutoff index of 0.8 U/mL. Box plots are weighted with respect to the demographics of Japan.

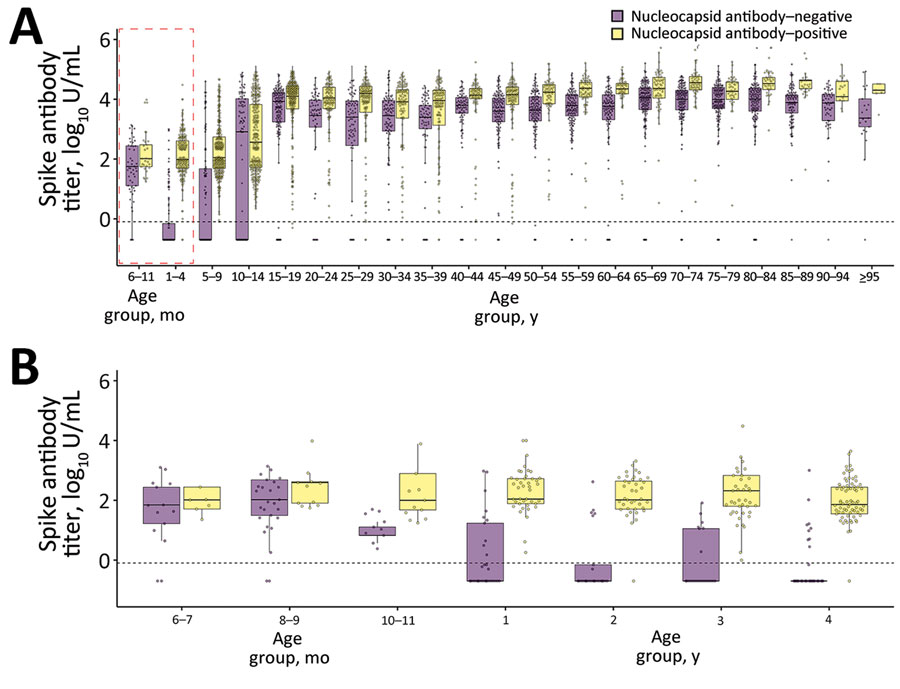
Figure 2. Age-stratified weighted concentrations of spike SARS-Cov-2 antibody stratified by nucleocapsid SARS-Cov-2 antibody seroprevalence in Japan, 2023. A) Spike antibody concentrations stratified by nucleocapsid antibody seroprevalence in persons 6 months to >95 years of age. Red dashed box represents the age group analyzed in panel B. B) Spike antibody concentrations stratified by nucleocapsid antibody seroprevalence in persons 6 months to 4 years of age. Horizonal lines within boxes indicate the median, box tops and bottoms indicate the 75th percentile and 25th percentile, and whiskers extend to 1.5 times the interquartile range (IQR) from 25th percentile and 75th percentile. Dotted horizontal lines represent the cutoff index of 0.8 U/mL. Box plots are weighted with respect to the demographics of Japan.

Main Article

1These first authors contributed equally to this article.

2These senior authors contributed equally to this article.

Page created: April 11, 2024
Page updated: May 22, 2024
Page reviewed: May 22, 2024
The conclusions, findings, and opinions expressed by authors contributing to this journal do not necessarily reflect the official position of the U.S. Department of Health and Human Services, the Public Health Service, the Centers for Disease Control and Prevention, or the authors' affiliated institutions. Use of trade names is for identification only and does not imply endorsement by any of the groups named above.
file_external