Volume 30, Number 9—September 2024
Dispatch
Mosquitoes as Vectors of Mycobacterium ulcerans Based on Analysis of Notifications of Alphavirus Infection and Buruli Ulcer, Victoria, Australia
Figure 2
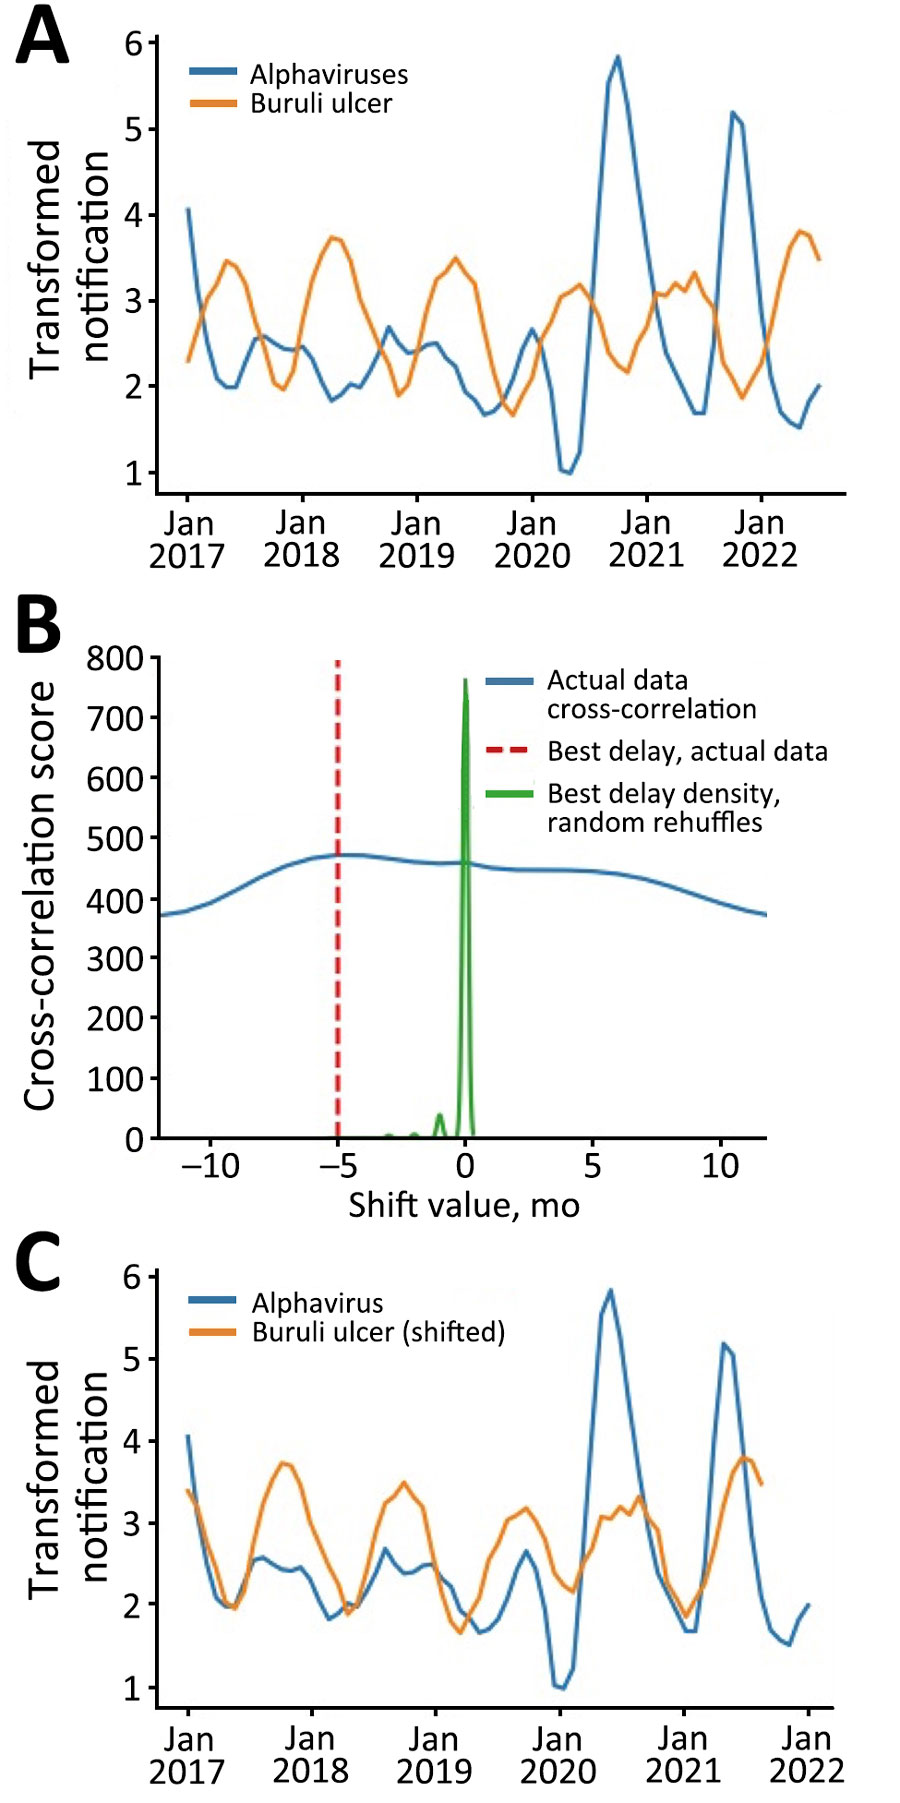
Figure 2. Analysis of temporally adjusted Buruli ulcer and alphavirus notifications in Victoria, Australia, 2017–2022. A) Notifications over time (no delay). Plot of the 2 datasets (outliers censored) was log transformed and smoothed by month and year. B) Optimal shift and cross-correlation analysis. Algorithmically determined cross correlation (blue line) and optimal curve shift of −5 months (vertical red dashed line) that best aligned the 2 log transformed curves shown in panel A. In green is a density curve that depicts the outcomes of 1,000 random data shuffles, serving as a visual indicator of how the observed −5 months curve shift diverges from random chance expectations. C) Notifications over time shifted to incorporate the Buruli ulcer incubation period of 5 months. Cross-correlation aligned smoothed log-transformed notification curves show synchronous inferred transmission peaks and troughs for both alphavirus infection and Buruli ulcer.