Volume 30, Number 9—September 2024
Dispatch
Epidemiology of Lyme Disease Diagnoses among Older Adults, United States, 2016–20191
Figure 2
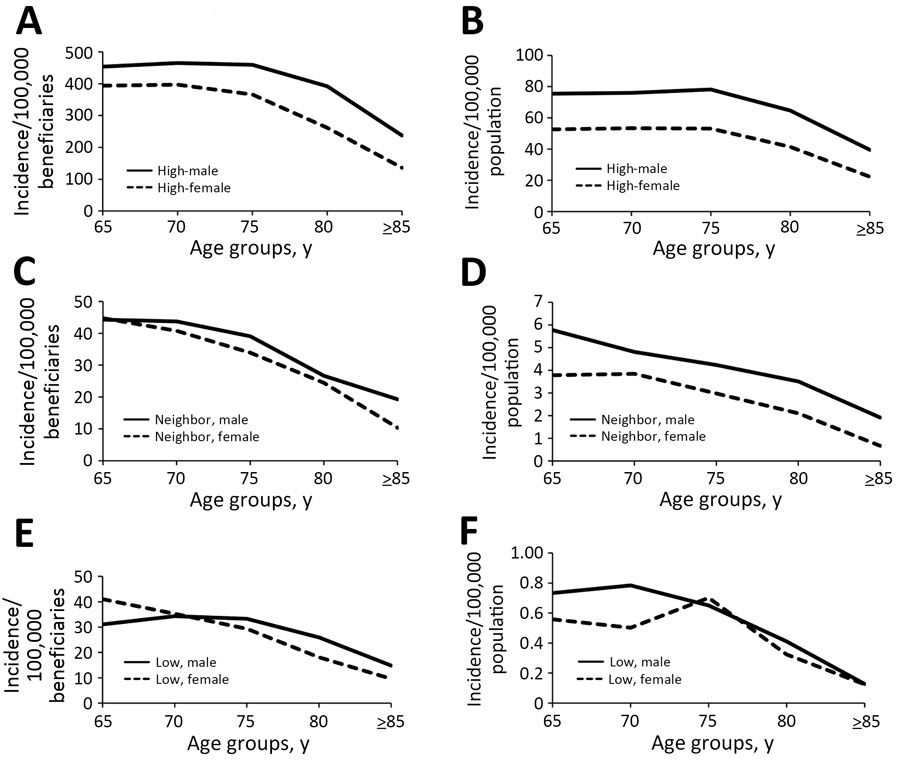
Figure 2. Lyme disease incidence for older adults, United States, 2016–2019. Results according to age group, sex, and geographic category of Lyme disease endemicity based on Medicare fee-for-service beneficiary data (A, C, F) and from US surveillance data (B, D, F). A, B) Disease incidence for men and women in high-incidence states. C, D) Disease incidence for men and women in neighboring states. E, F) Disease incidence for men and women in low-incidence states. Incidence calculated as diagnoses/100,000 beneficiaries in Medicare fee-for-service plans or cases/100,000 population among each subcategory. Scales for each y-axis differ substantially to underscore overall age-related incidence patterns but do not permit direct comparison of the magnitude of Lyme disease between systems or geographic categories.
1Preliminary results from this study were presented at the International Conference on Emerging Infectious Diseases; August 7–10, 2022, Atlanta, Georgia, USA.