Skip directly to site content Skip directly to page options Skip directly to A-Z link Skip directly to A-Z link Skip directly to A-Z link

Disclaimer: Early release articles are not considered as final versions. Any changes will be reflected in the online version in the month the article is officially released.

Volume 30, Number 9—September 2024
Research Letter

SARS-CoV-2 Dynamics in the English Premier League Testing Program

Adam J. KucharskiComments to Author , Timothy W. Russell, Joel Hellewell, Sebastian Funk, Andrew Steele, W. John Edmunds, and Mark Gillett
Author affiliations: London School of Hygiene & Tropical Medicine, London, UK (A.J. Kucharski, T.W. Russell, S. Funk, W.J. Edmunds); European Bioinformatics Institute at Wellcome Genome Campus, Hinxton, UK (J. Hellewell); Stride Health Group, London (A. Steele); The Football Association Premier League, London (M. Gillett)

Main Article

Figure

Infection dynamics in the English Premier League testing program for SARS-CoV-2, 2020–2022. A) Weekly PCR test positivity. Dots indicate infections; error bars indicate 95% CIs. Colored lines show inferred mean prevalence in the UK ONS Community Infection Survey. Gray shading shows period where the testing protocol was based on a rapid antigen test, with subsequent confirmatory PCR; hence, PCR positivity is not comparable because sampling was nonrandom. B) Distribution of individual Ct values over time since first positive test. Dashed circles indicate estimated reinfections: orange represents Alpha wave, in which 1 person was reinfected, as determined from 3 samples; purple represents Delta wave, in which samples indicate that 3 persons were reinfected. Ct, cycle threshold; ONS, Office for National Statistics.

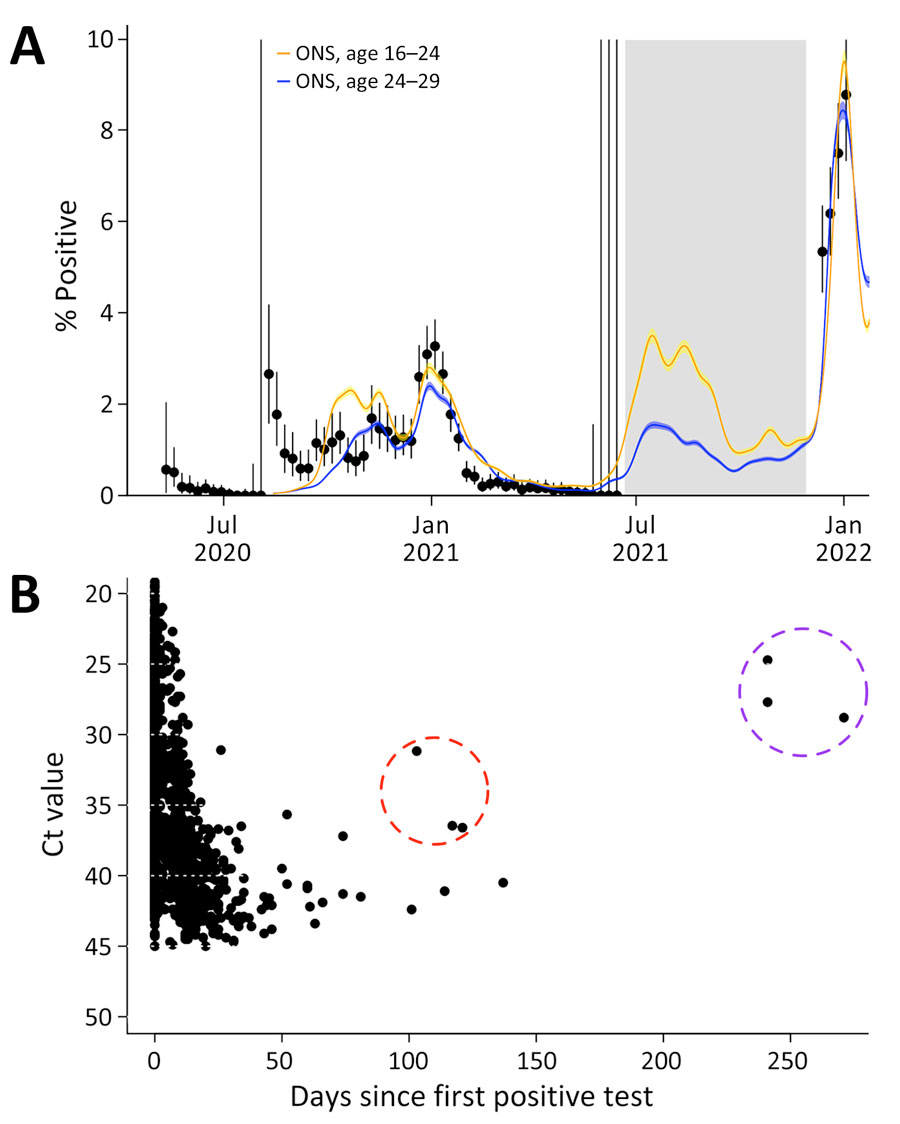
Figure. Infection dynamics in the English Premier League testing program for SARS-CoV-2, 2020–2022. A) Weekly PCR test positivity. Dots indicate infections; error bars indicate 95% CIs. Colored lines show inferred mean prevalence in the UK ONS Community Infection Survey. Gray shading shows period where the testing protocol was based on a rapid antigen test, with subsequent confirmatory PCR; hence, PCR positivity is not comparable because sampling was nonrandom. B) Distribution of individual Ct values over time since first positive test. Dashed circles indicate estimated reinfections: orange represents Alpha wave, in which 1 person was reinfected, as determined from 3 samples; purple represents Delta wave, in which samples indicate that 3 persons were reinfected. Ct, cycle threshold; ONS, Office for National Statistics.

Main Article

Page created: August 14, 2024
Page updated: August 14, 2024
Page reviewed: August 14, 2024
The conclusions, findings, and opinions expressed by authors contributing to this journal do not necessarily reflect the official position of the U.S. Department of Health and Human Services, the Public Health Service, the Centers for Disease Control and Prevention, or the authors' affiliated institutions. Use of trade names is for identification only and does not imply endorsement by any of the groups named above.
file_external