Skip directly to site content Skip directly to page options Skip directly to A-Z link Skip directly to A-Z link Skip directly to A-Z link
Volume 31, Number 1—January 2025
Dispatch

Toxigenic Corynebacterium diphtheriae Infections in Low-Risk Patients, Switzerland, 2023

Pascal Urwyler, Daniel Goldenberger, Kerstin Grosheintz, Rahel Tarnutzer, Maike Markstein, Celine Sucker, Anna-Maria Balestra, Lukas Merki, Michelle Baumann, Nicolas Gürtler, Aurélien Emmanuel Martinez, Matthias von Rotz, Branislav Ivan, Claudia Lang, Pascal Schläepfer, Peter M. Keller1, Eva Wuerfel1, and Sarah Tschudin-Sutter1
Author affiliation: University Hospital Basel, University of Basel, Basel, Switzerland (P. Urwyler, D. Goldenberger, M. Baumann, N. Guertler, A.E. Martinez, M. von Rotz, B. Ivan, C. Lang, P. Schläepfer, P.M. Keller, S. Tschudin-Sutter); Canton of Basel-Stadt, Basel (K. Grosheintz, R. Tarnutzer, M. Markstein, C. Sucker, E. Wuerfel); St. Claraspital Basel (A.-M. Balestra, L. Merki)

Main Article

Figure

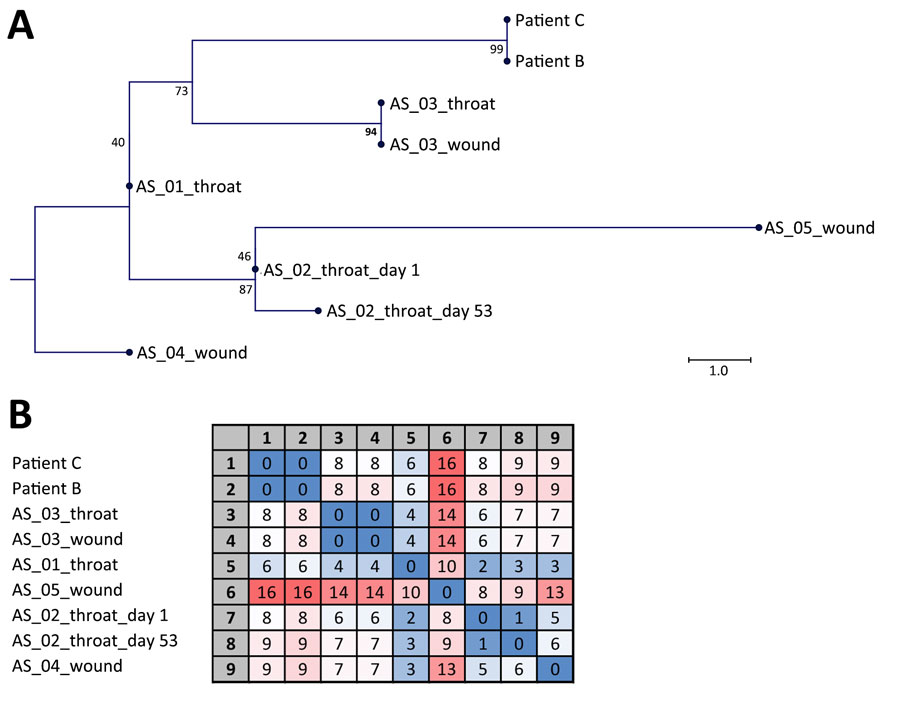
Sequencing data from study of toxigenic Corynebacterium diphtheriae infections in low-risk patients, Switzerland, 2023. Maximum-likelihood single-nucleotide polymorphism (SNP) phylogeny (A) and SNP matrix (B) of C. diphtheriae isolates derived from patient B, patient C, and 5 asylum seekers (AS). Numbers at the tree nodes in panel A denote bootstrap values as percentages from 1,000 replicates; scale bar indicates substitutions per site. Matrix in panel B contains the pairwise number of SNP differences used to generate the tree. We used a 3-color scale, where blue represents lowest values, red highest values, and white intermediate values.

Figure. Sequencing data from study of toxigenic Corynebacterium diphtheriae infections in low-risk patients, Switzerland, 2023. Maximum-likelihood single-nucleotide polymorphism (SNP) phylogeny (A) and SNP matrix (B) of C. diphtheriae isolates derived from patient B, patient C, and 5 asylum seekers (AS). Numbers at the tree nodes in panel A denote bootstrap values as percentages from 1,000 replicates; scale bar indicates substitutions per site. Matrix in panel B contains the pairwise number of SNP differences used to generate the tree. We used a 3-color scale, where blue represents lowest values, red highest values, and white intermediate values.

Main Article

1These senior authors contributed equally to this article.

Page created: December 03, 2024
Page updated: December 22, 2024
Page reviewed: December 22, 2024
The conclusions, findings, and opinions expressed by authors contributing to this journal do not necessarily reflect the official position of the U.S. Department of Health and Human Services, the Public Health Service, the Centers for Disease Control and Prevention, or the authors' affiliated institutions. Use of trade names is for identification only and does not imply endorsement by any of the groups named above.
file_external