Skip directly to site content Skip directly to page options Skip directly to A-Z link Skip directly to A-Z link Skip directly to A-Z link
Volume 31, Number 1—January 2025
Dispatch

Influenza A(H5N1) Virus Clade 2.3.2.1a in Traveler Returning to Australia from India, 2024

Yi-Mo Deng1, Michelle Wille1, Clyde Dapat, Ruopeng Xie, Olivia Lay, Heidi Peck, Andrew J. Daley, Vijaykrishna Dhanasakeran, and Ian G. BarrComments to Author 
Author affiliation: World Health Organization Collaborating Centre for Reference and Research on Influenza, Peter Doherty Institute for Infection and Immunity, Melbourne, Victoria, Australia (Y.-M. Deng, M. Wille, C. Dapat, O. Lay, H. Peck, I.G. Barr); The University of Melbourne, Melbourne (M. Wille, I.G. Barr); The University of Hong Kong, Hong Kong, China (R. Xie, V. Dhanasakeran); The Royal Children's and Royal Women's Hospitals, Parkville, Victoria, Australia (A.J. Daley)

Main Article

Figure 1

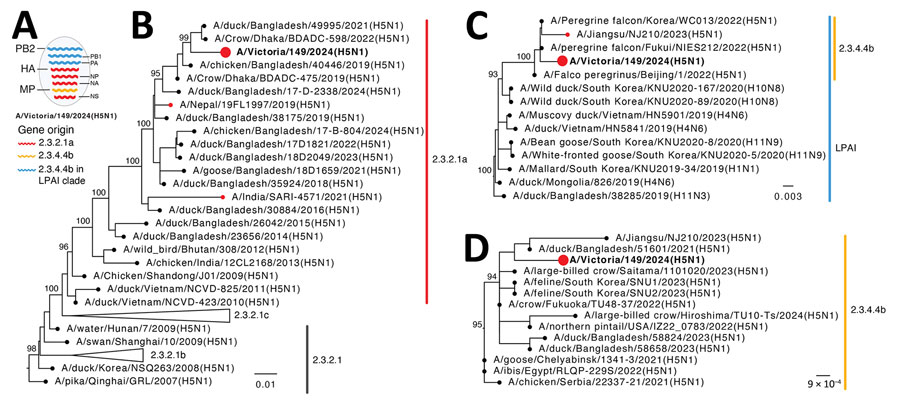
Evolutionary origins of isolate A/Victoria/149/2024(H5N1) (red circles and bold text) in study of influenza A(H5N1) virus clade 2.3.2.1a in traveler returning to Australia from India, 2024. A) Reassortant origins of A/Victoria/149/2024 based on analysis of each segment; detailed phylogenies for all segments are provided in Appendix Figure 1). B–D) Maximum-likelihood trees for HA (B), PB2 (C), and M (D) genes with a sample of BLAST-matched sequences (https://blast.ncbi.nlm.nih.gov). Bootstrap values >90% for key nodes are shown. Scale bars indicate number of nucleotide substitutions per site for each gene. HA, hemagglutinin; LPAI, low pathogenicity avian influenza; M, matrix protein; NP, nucleoprotein; NS, nonstructural; PA, polymerase acidic; PB1, polymerase basic 1; PB2, polymerase basic 2.

Figure 1. Evolutionary origins of isolate A/Victoria/149/2024(H5N1) (red circles and bold text) in study of influenza A(H5N1) virus clade 2.3.2.1a in traveler returning to Australia from India, 2024. A) Reassortant origins of A/Victoria/149/2024 based on analysis of each segment; detailed phylogenies for all segments are provided in Appendix Figure 1). B–D) Maximum-likelihood trees for HA (B), PB2 (C), and M (D) genes with a sample of BLAST-matched sequences (https://blast.ncbi.nlm.nih.gov). Bootstrap values >90% for key nodes are shown. Scale bars indicate number of nucleotide substitutions per site for each gene. HA, hemagglutinin; LPAI, low pathogenicity avian influenza; M, matrix protein; NP, nucleoprotein; NS, nonstructural; PA, polymerase acidic; PB1, polymerase basic 1; PB2, polymerase basic 2.

Main Article

1These authors contributed equally to this article.

Page created: November 20, 2024
Page updated: December 22, 2024
Page reviewed: December 22, 2024
The conclusions, findings, and opinions expressed by authors contributing to this journal do not necessarily reflect the official position of the U.S. Department of Health and Human Services, the Public Health Service, the Centers for Disease Control and Prevention, or the authors' affiliated institutions. Use of trade names is for identification only and does not imply endorsement by any of the groups named above.
file_external