Volume 31, Number 10—October 2025
Research
Differences in COVID-19 Fatality Rates among Ethnic Groups, Hawaii, USA, 2020–2022
Gehan Devendra , Madeleine Chai, Eyrica Sumida, Richard Chen, Maan Gozun, Dominic Chow, and F. DeWolfe Miller
Figure 2
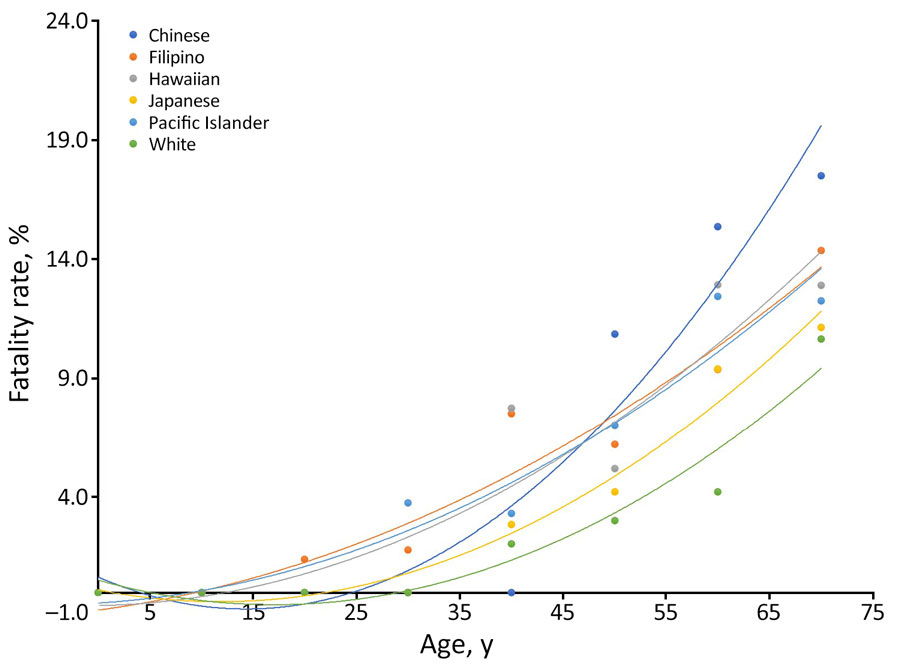
Figure 2. Fatality rates by age in study of differences in COVID-19 fatality rates among ethnic groups, Hawaii, USA, 2020–2022. Lines show polynomial trends among each racial or ethnic group; dots indicate average per 10-year age group. Black dotted line indicates mean fatality rate.
Page created: August 19, 2025
Page updated: September 25, 2025
Page reviewed: September 25, 2025
The conclusions, findings, and opinions expressed by authors contributing to this journal do not necessarily reflect the official position of the U.S. Department of Health and Human Services, the Public Health Service, the Centers for Disease Control and Prevention, or the authors' affiliated institutions. Use of trade names is for identification only and does not imply endorsement by any of the groups named above.