Volume 31, Number 2—February 2025
Research Letter
Human Infection with Avian Influenza A(H9N2) Virus, Vietnam, April 2024
Figure 2
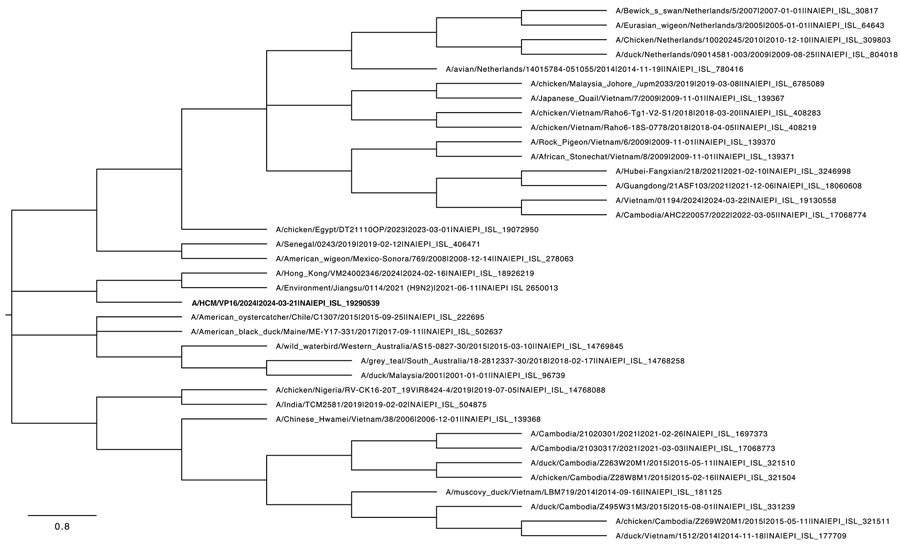
Figure 2. Phylogenetic tree of the neuraminidase gene of human influenza A(H9N2) virus isolated in Vietnam (bold text) and reference sequences, constructed using the maximum-likelihood method and Tamura-Nei model. The bootstrap consensus tree inferred from 1,000 replicates represents the evolutionary history of the taxa analyzed. Branches corresponding to partitions reproduced in <50% bootstrap replicates are collapsed. We obtained initial trees for the heuristic search automatically by applying neighbor-joining and BioNJ algorithms to a matrix of pairwise distances estimated using the Tamura-Nei model and then selecting the topology with superior log likelihood value. This analysis involved 37 nt sequences; codon positions included were first + second + third + noncoding, for a total of 1,524 positions in the final dataset. Evolutionary analyses were conducted in MEGA 11 (https://www.megasoftware.net). Scale bar represents 0.8 nucleotide substitutions per site.