Volume 31, Number 3—March 2025
Research Letter
Annual Hospitalizations for COVID-19, Influenza, and Respiratory Syncytial Virus, United States, 2023–2024
Figure
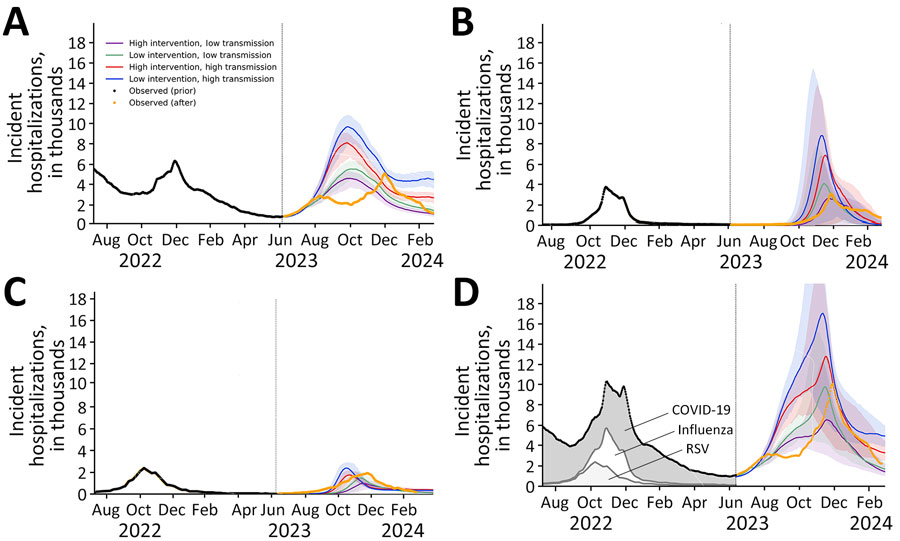
Figure. Projected daily hospital admissions attributable to COVID-19 (A), influenza (B), RSV (C), and COVID-19, influenza, or RSV infections combined (D) under multiple scenarios with varying viral transmission rates and varying effect of medical countermeasures, United States, June 8, 2023–March 30, 2024. Values are the 7-day average number of hospital admissions attributable to infections by the specified viruses. The solid lines indicate medians; shaded ribbons indicate 95% CIs across 200 stochastic simulations. Black dots in all graphs and gray shading in panel D indicate the reported 7-day average hospital admissions for the 3 viruses before the projection period (9,10); orange lines indicate 7-day average hospital admissions from the projection period that were not available at the time of the initial analysis. RSV, respiratory syncytial virus.
References
- World Health Organization. Statement on the fifteenth meeting of the IHR (2005) Emergency Committee on the COVID-19 pandemic. 2023 May 5 [cited 2023 Aug 13]. https://www.who.int/news/item/05-05-2023-statement-on-the-fifteenth-meeting-of-the-international-health-regulations-(2005)-emergency-committee-regarding-the-coronavirus-disease-(covid-19)-pandemic
- Kumari M, Lu RM, Li MC, Huang JL, Hsu FF, Ko SH, et al. A critical overview of current progress for COVID-19: development of vaccines, antiviral drugs, and therapeutic antibodies. J Biomed Sci. 2022;29:68. DOIPubMedGoogle Scholar
- Food and Drug Administration. Respiratory syncytial virus (RSV). 2024 Oct 22 [cited 2024 Sep 4]. https://www.fda.gov/consumers/covid-19-flu-and-rsv/respiratory-syncytial-virus-rsv
- Centers for Disease Control and Prevention. Weekly COVID-19 vaccination dashboard. 2025 Jan 15 [cited 2024 Sep 4]. https://www.cdc.gov/vaccines/imz-managers/coverage/covidvaxview/interactive/vaccination-dashboard.html
- Kaku Y, Okumura K, Padilla-Blanco M, Kosugi Y, Uriu K, Hinay AA Jr, et al.; Genotype to Phenotype Japan (G2P-Japan) Consortium. Virological characteristics of the SARS-CoV-2 JN.1 variant. Lancet Infect Dis. 2024;24:
e82 . DOIPubMedGoogle Scholar - Centers for Disease Control and Prevention. Influenza vaccine doses distributed. 2025 Jan 15 [cited 2023 Sep 4]. https://www.cdc.gov/flu/fluvaxview/dashboard/vaccination-doses-distributed.html
- Centers for Disease Control and Prevention. Infant protection against respiratory syncytial virus (RSV) by maternal RSV vaccination or receipt of nirsevimab, and intent for nirsevimab receipt, United States. 2025 Jan 15 [cited 2023 Aug 13]. https://www.cdc.gov/vaccines/imz-managers/coverage/rsvvaxview/nirsevimab-coverage.html.
- Centers for Disease Control and Prevention. Respiratory syncytial virus (RSV) vaccination coverage and intent for vaccination, adults 75 years and older and adults 60–74 years with high-risk conditions, United States. 2025 Jan 15 [cited 2024 Sep 4]. https://www.cdc.gov/vaccines/imz-managers/coverage/rsvvaxview/adults-60-coverage-intent.html
- US Department of Health and Human Services. COVID-19 reported patient impact and hospital capacity by state timeseries (raw). 2024 Jun 28 [cited 2024 May 3]. https://healthdata.gov/Hospital/COVID-19-Reported-Patient-Impact-and-Hospital-Capa/g62h-syeh/about_data
- Centers for Disease Control and Prevention. RSV-NET interactive dashboard 2024 Oct 10 [cited 2024 Sep 4]. https://www.cdc.gov/rsv/research/rsv-net/dashboard.html
1Current affiliation: The University of Texas Health Science Center, Houston, Texas, USA.
2These first authors contributed equally to this article.
3These authors contributed equally to this article.