Volume 31, Number 7—July 2025
Synopsis
Systematic Review of Contact Investigation Costs for Tuberculosis, United States
Garrett R. Beeler Asay , Kai H. Young, Tempest D. Hill, and Gibril J. Njie
Figure 2
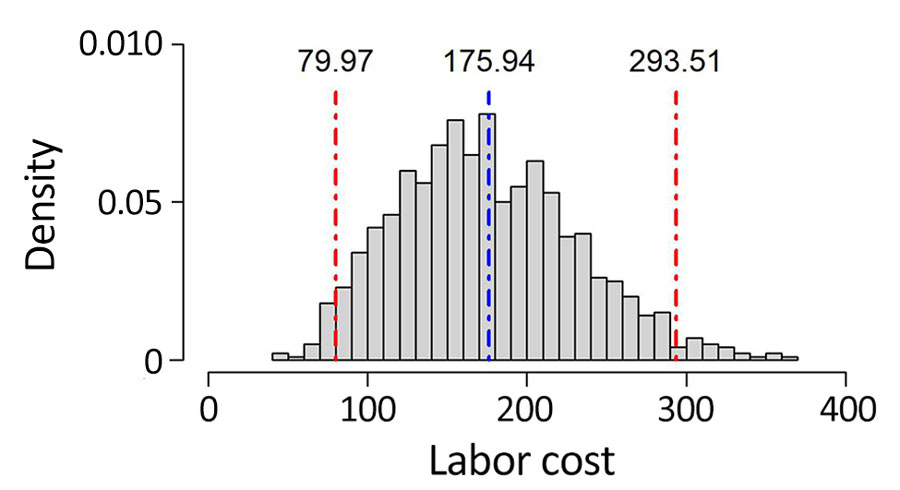
Figure 2. Density plot for labor costs of tuberculosis contact investigations in the United States. y-axis indicates bootstrapped probability density function (1,000 random sample draws). Costs per investigation were determined by using 2022 US dollar values. Blue dashed vertical line indicates the mean cost ($175.94); red dashed vertical lines indicate 95% CI ($79.96–$293.51).
Page created: May 14, 2025
Page updated: June 25, 2025
Page reviewed: June 25, 2025
The conclusions, findings, and opinions expressed by authors contributing to this journal do not necessarily reflect the official position of the U.S. Department of Health and Human Services, the Public Health Service, the Centers for Disease Control and Prevention, or the authors' affiliated institutions. Use of trade names is for identification only and does not imply endorsement by any of the groups named above.