Volume 6, Number 5—October 2000
Research
Toxin Gene Expression by Shiga Toxin-Producing Escherichia coli: the Role of Antibiotics and the Bacterial SOS Response
Figure 1
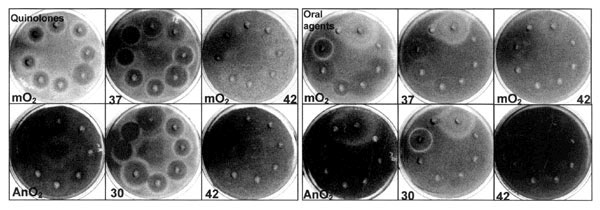
Figure 1. Zones of stx2 expression induced by various antimicrobial agents under different incubation conditions. The disc-diffusion assay plates demonstrate background levels and zones of blue coloration related to reporter gene β-galactosidase activity produced by our reporter strain. Digital images were acquired and processed identically. Color was encoded by the CMYK system, and only the cyan component is displayed as a gray-scale image. Blue zones appear as lighter areas of the plate, the intensity of which represents the blue intensity as judged by direct comparison. Abbreviations: mO2, microaerobic and AnO2, anaerobic incubation conditions; numbers denote incubation temperatures (°C). Left panel, quinolones (clockwise from top): ofloxacin, nalidixic acid, cinoxacin, enrofloxacin, flumeqine, ciprofloxacin, perfloxacin, and norfloxacin. Right panel, other oral agents (clockwise from top): trimethoprim, erythromycin, doxycycline, chloramphenicol, cephalexin, amoxycillin, furazolidone, and sulphamethoxazole.