Skip directly to site content Skip directly to page options Skip directly to A-Z link Skip directly to A-Z link Skip directly to A-Z link
Volume 8, Number 6—June 2002
Perspective

Clinical Epidemiology of Malaria in the Highlands of Western Kenya

Simon I. Hay*†Comments to Author , Abdisalan M. Noor†, Milka Simba†, Millie Busolo‡, Helen L. Guyatt*†, Sam A. Ochola‡, and Robert W. Snow*†‡
Author affiliations: *University of Oxford, Oxford, UK; †Kenya Medical Research Institute/Wellcome Trust Collaborative Programme, Nairobi, Kenya; ‡Ministry of Health, Nairobi, Kenya;

Main Article

Figure 1

Spider plots of adult, child, and total admissions and time series of adult:child ratio for three study hospitals in Kenya. Spider plots of malaria admissions in Kilgoris (a), Kisii (c), and Tabaka (e). The data are monthly averages for the 1980–1999, 1987–2000, and 1981–2000 time periods, respectively. Adult cases (>15 years of age) are shown in blue, child cases (<15 years) are shown in red, and total cases in black. Time series plots of the monthly adult:child ratio data are also shown for Kilgoris (b), Kisii (d), and Tabaka (f) as the continuous black line. The dashed line represents the value of 1 where adult and child admissions are equal, as is to be expected in true epidemic conditions (39–41). The bold line is a 25-point (month) moving average of the adult:child ratio.

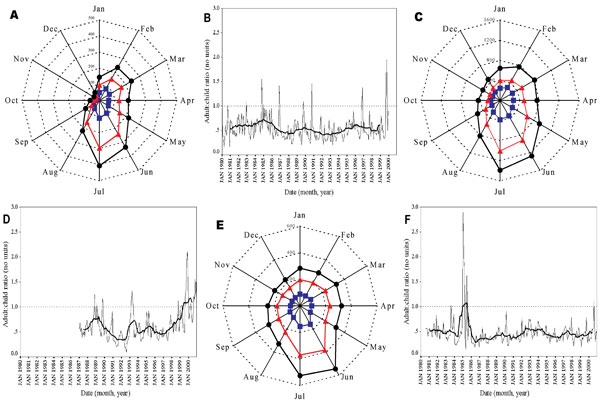
Figure 1. Spider plots of adult, child, and total admissions and time series of adult:child ratio for three study hospitals in Kenya. Spider plots of malaria admissions in Kilgoris (a), Kisii (c), and Tabaka (e). The data are monthly averages for the 1980–1999, 1987–2000, and 1981–2000 time periods, respectively. Adult cases (>15 years of age) are shown in blue, child cases (<15 years) are shown in red, and total cases in black. Time series plots of the monthly adult:child ratio data are also shown for Kilgoris (b), Kisii (d), and Tabaka (f) as the continuous black line. The dashed line represents the value of 1 where adult and child admissions are equal, as is to be expected in true epidemic conditions (39–41). The bold line is a 25-point (month) moving average of the adult:child ratio.

Main Article

Page created: July 16, 2010
Page updated: July 16, 2010
Page reviewed: July 16, 2010
The conclusions, findings, and opinions expressed by authors contributing to this journal do not necessarily reflect the official position of the U.S. Department of Health and Human Services, the Public Health Service, the Centers for Disease Control and Prevention, or the authors' affiliated institutions. Use of trade names is for identification only and does not imply endorsement by any of the groups named above.
file_external