Volume 9, Number 11—November 2003
Research
Genetic Variation among Temporally and Geographically Distinct West Nile Virus Isolates, United States, 2001, 2002
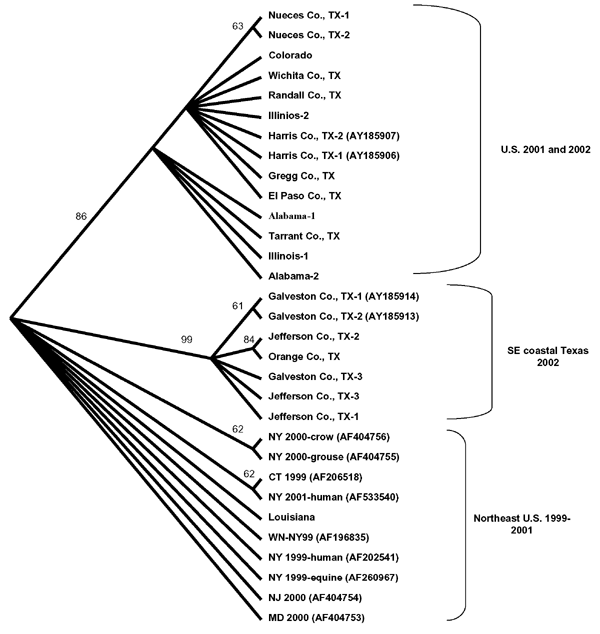
Figure 3

Figure 3. . Cladogram based on maximum parsimony analysis comparing a 2,004-nucleotide sequence of 22 West Nile virus isolates collected during 2001 and 2002 with a homologous region of WN virus isolates collected in 1999, 2000, and 2001 from the northeastern United States. Numbers indicate bootstrap confidence estimates based on 500 replicates for clades supported to the right. Numbers in parenthesis represent GenBank accession numbers.
Page created: April 20, 2012
Page updated: April 20, 2012
Page reviewed: April 20, 2012
The conclusions, findings, and opinions expressed by authors contributing to this journal do not necessarily reflect the official position of the U.S. Department of Health and Human Services, the Public Health Service, the Centers for Disease Control and Prevention, or the authors' affiliated institutions. Use of trade names is for identification only and does not imply endorsement by any of the groups named above.